Every marketer — yes, every marketer — should want to use marketing analytics to deepen their insight into performance and increase the effectiveness of their campaigns. Doesn’t matter if you work for a boutique agency or a Fortune 500 giant. We all have the potential to achieve amazing growth through analytics.
To be clear, that can take time and hard work. But it is possible to break through and achieve the kinds of marketing insights that can propel your business to new levels of success. It’s all a matter of identifying where your analytics practice stands now and, building on what you already have, working toward your ultimate vision of a data-driven marketing strategy.
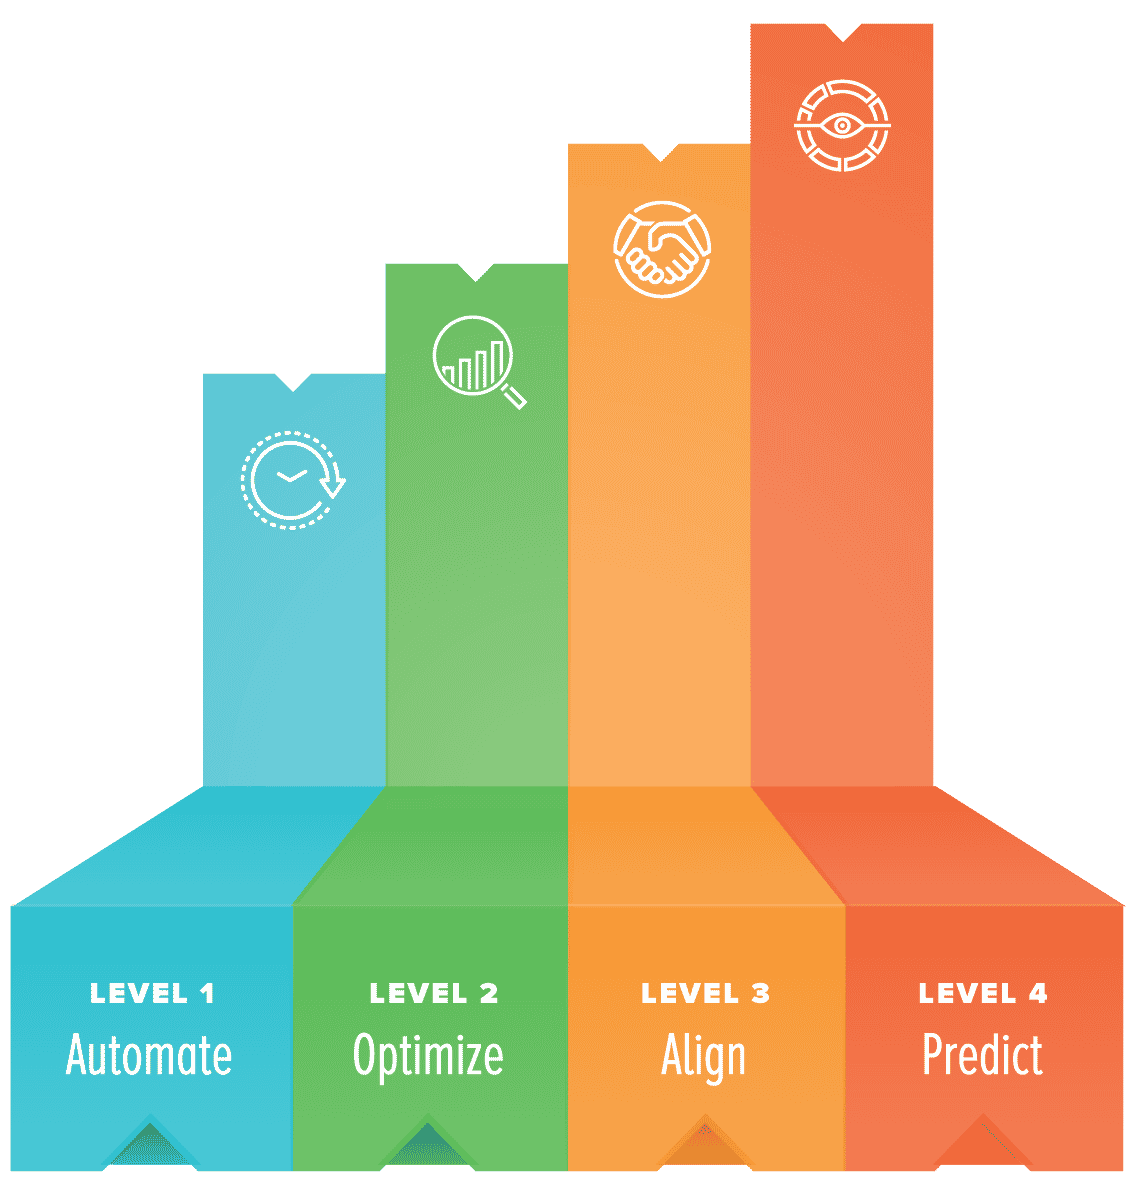
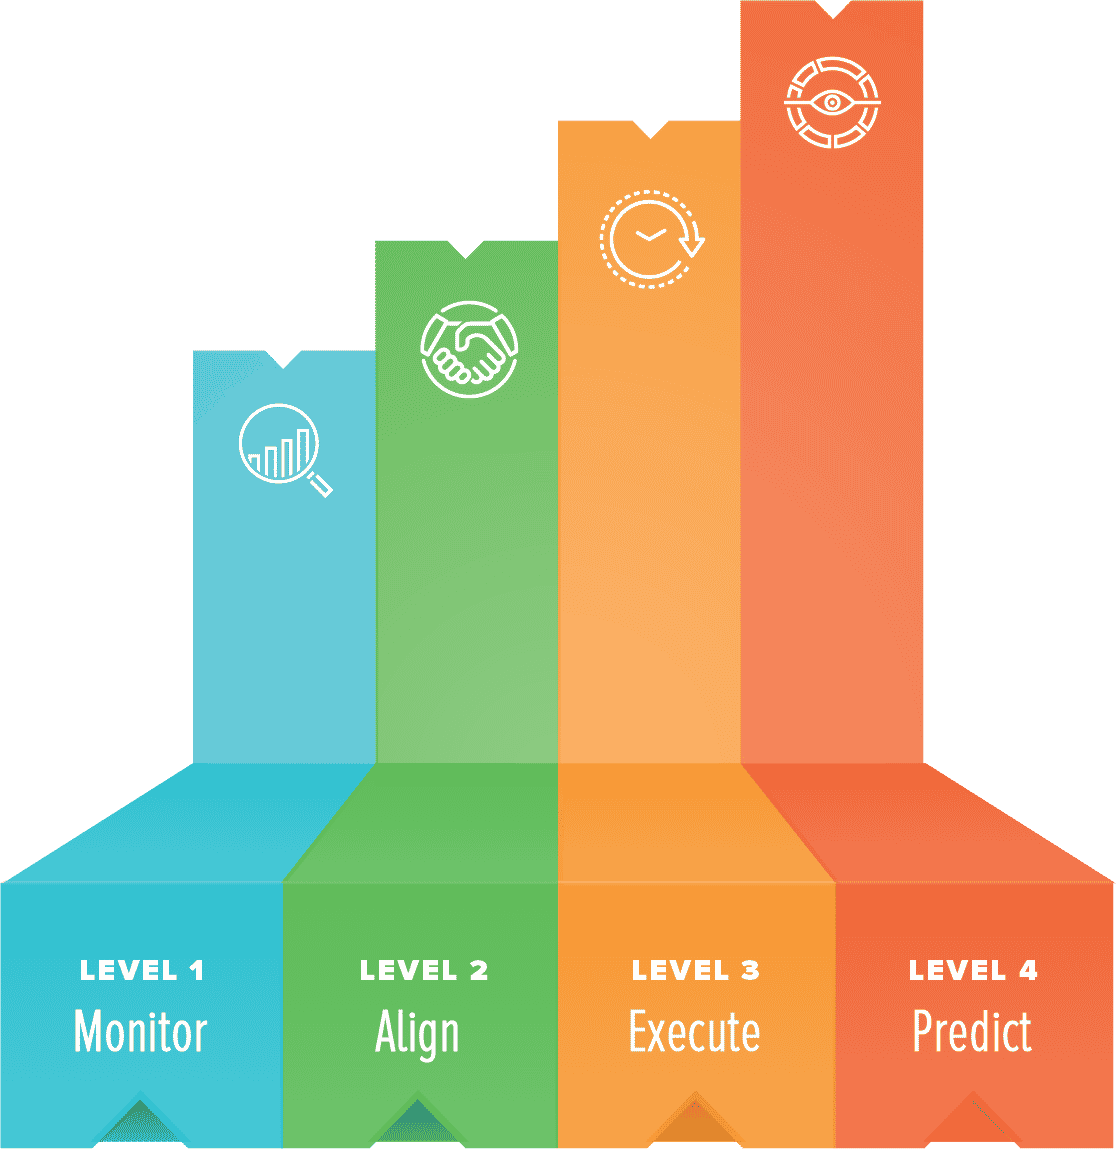
We created the Marketing Analytics Maturity Curve™ to guide marketers as they gradually increase their levels of insight. Think of it as a roadmap for increasing your ability to use data to prove marketing’s value and grow sales, revenue and other critical business outcomes.
In this post, you’ll learn:
- Why automating reporting across marketing channels is the crucial first step
- What you can do to better execute and optimize campaigns
- How to maximize your strategy and tactics by aligning marketing and sales
- How predictive analytics can deliver finely tuned guidance for future marketing efforts
Level 1 | Measure
Measure Performance Metrics Across Channels
If you want to get better at marketing, you need visibility into how your campaigns are performing, ideally in as close to real time as possible.
For a lot of marketers, that’s a huge problem!
If you’re like most of us, you’re probably using multiple channels to reach your desired audience. Could be search, social, TV, OOH, direct mail, podcasts, you name it. Each of those sources produces a phenomenal amount of performance data that should, in theory, give you clues into what tactics are successful.
Except accessing that data can be a very time-consuming process. Some marketers spend half their month downloading reports from different marketing platforms and putting them into a format they (and their stakeholders) can understand.
And good luck if you want to see results for an entire channel (such as all your social or all your search) or cross-channel (all your paid media) in a single view. Individual sources will probably use different metrics and dimensions, so you get to spend even more time making everything “speak the same language.”
You spend so much time building reports that you aren’t really able to use them to improve your marketing.
Fortunately, these are solvable problems.
Data Aggregation & Unification
Step one is to implement automated data aggregation and unification.
Which is just a fancy way of saying “get a software tool that automatically pulls performance data from Google Analytics, Facebook, MailChimp or any other marketing platforms and media buys you’re using in your campaigns.”
In a perfect world, your aggregation tool should also unify data from different sources — that is, bring them together in a dataset where each source’s dimensions and metrics line up. (A lot of marketing analytics software can’t do this. Our best-in-class marketing intelligence platform can.)
As a result, your reporting becomes much more efficient — a massive win. You’re spending less time on grunt work, which frees you up to study your data for relevant insights. And because data is coming in more quickly, you have a greater ability to optimize marketing spend and tactics.
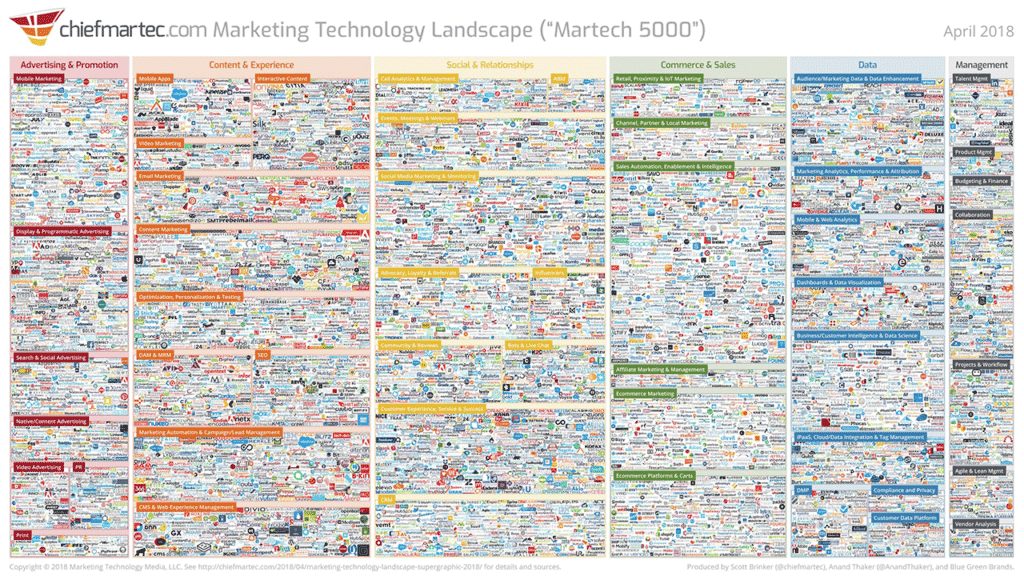
There are literally THOUSANDS of different sources of marketing data.
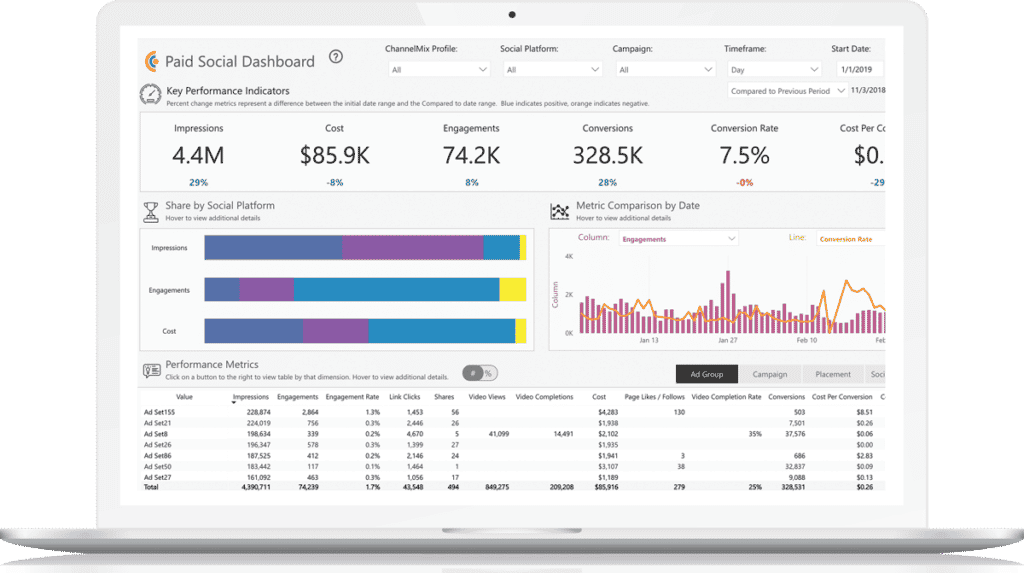
Source-Level & Cross-Channel Marketing Dashboards
Your aggregation software should then automatically pipe that data into a report. Ideally, that’s a marketing dashboard. But it could also be Excel, Google Sheets or some other spreadsheet app with the ability to visualize the data. Not ideal, but it’s where a lot of marketers start. The key is that your reports are updating on their own.
You can produce reporting with different levels of granularity. Maybe you only use Google Ads to promote your business — you just need a source-level report dedicated to that single platform. But most marketers won’t fit into that category. They’re going to need dashboards that show performance at the channel level (all organic social or all paid search, for example) and cross-channel (all your digital paid media or even allllll your marketing channels, both offline and online).
Once you achieve that level of visibility, you have a whole new understanding of how your marketing investments are performing. You can get a 10,000-foot view or drill into specific channels and compare sources. You’ve created a foundation for even more sophisticated analysis.
By the way, if you’re not at Level 1 yet? Maybe you’re still downloading performance data by hand and relying strictly on spreadsheets? Technically, we call that Level 0. And that’s fine. Getting from Level 0 to Level 1 is incredibly fast. It could just take an afternoon to set up the necessary tools to automate your data and reporting.
Automatically piping analysis-ready data into your dashboarding tool can save you hundreds of hours a month.
Level 2 | Optimize
Plan and Optimize Marketing Campaigns for Enhanced ROI
The first level is all about setting up your analytics foundation and automating repetitive work to free up your time to tackle more complex analysis. In this case, we're talking about using analytics to understand how and when you should invest your marketing dollars to maximize ROI.
There are three capabilities you need at this level.
Campaign Planning & Tracking
Let’s start with an obvious fact: Almost all marketing is executed as part of a campaign. I mean, duh, right?
But what isn’t as obvious is how to report on campaign results when you’re using multiple platforms and channels to reach audiences. It’s one thing to create channel-level views — connecting performance data to specific campaigns introduces a new level of complexity to your data management efforts.
The solution? Use a dedicated tool for planning and tracking all the ad and media placements that are part of your campaign. It could be a dedicated tracking tool that generates keys or tags you can attach to campaign names. It could be something as simple as a consistent strategy for naming your campaigns or using tracking links, so that your analytics platform can unify the relevant data when it’s building campaign datasets.
You can also set up your tracking so that you have a greater ability to “slice and dice” datasets and drill into performance according to other dimensions like region, creative or audience.
You might find a dedicated tool a little easier to use for campaign planning and tracking; otherwise you have to manage all the tags and links in a spreadsheet. A dedicated tracking tool can often store data about the campaign — why it was created, how much budget is available, what the KPI goals are, etc.
For complex, multi-channel campaigns, we recommend investing in a tool that can help you standardize and manage tracking taxonomy.
Campaign Pacing & Optimization
At Level 3, you need the ability to understand how you’re pacing against your campaign’s goals and budget while the campaign is currently running.
Are you on track to generate enough leads or sales? Are you going to run out of money before the campaign reaches its goal?
Having that knowledge mid-campaign gives you the power to make adjustments to spend and tactics, so you can get back on track and optimize your campaign.
To unlock this capability, you don’t just need performance data, the stuff we talked about at Level 1 and 2. You need metadata — data about the campaign’s goals and budget — and you need it incorporated into the datasets you use for your reporting. That way, you can see how today’s conversion total compares to the number of conversions you’re responsible for generating. Look for an analytics platform or tracking tool that gives you this ability. (ChannelMix’s Keys module does.)
Multi-Channel Attribution Modeling
Holy cow, you’re really kicking butt now! There’s one more capability that will allow you to execute your campaigns at the highest level of performance.
You need to understand how each channel contributes to the value being created by the campaign. That way, you can tell what avenues deserve more (or less) of your budget.
You’ll need to apply an attribution model to “give credit” to the appropriate marketing channels and tactics, but you’ve already laid a lot of the groundwork by automating and unifying data from different channels (Level 1) and applying a tracking system that tags all channels or messages that are part of a campaign.
Some analytics platforms have built-in attribution models, whether that’s first touch, last touch, linear or another method. (Our Lead Generation dashboard actually lets you toggle between attribution methods.)
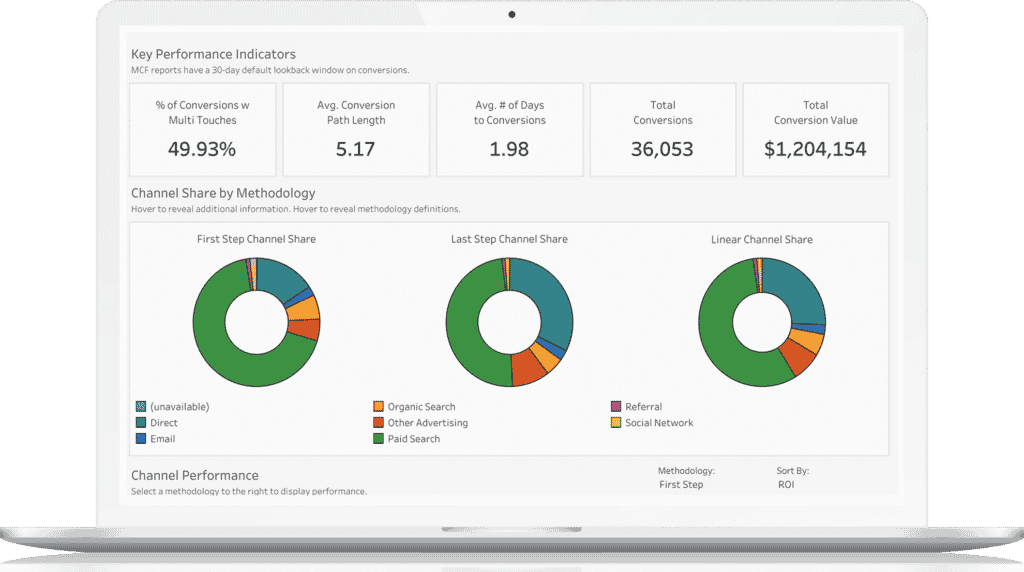
With the right data aggregation and tracking mechanisms in place, you can start to connect the dots between campaign spend, engagement and results.
Level 3 | ALIGN
Align Sales and Marketing Efforts for Greater Impact
While understanding campaign performance is important, it’s only part of the equation. You also need to understand how those efforts are leading to increased sales, revenue and other metrics.
You might just discover that your campaigns aren’t creating the desired outcomes. And if you can’t prove that you’re generating ROI, then marketing’s budget is in jeopardy of being cut — which in turn undermines the growth and stability of the entire organization.
That’s why Level 3 is so important. Here, you develop the insight necessary to align marketing investment with business outcomes. Suddenly, marketing stops being just another expense — it becomes an essential, valuable voice in your company’s business strategy.
There are three capabilities you need in order to accomplish that.
Marketing Performance Funnel
First, you’ll want reporting that shows how each channel (or if you want to get more granular, each data source) contributes to performance at each stage of your marketing funnel. The unified, aggregated data from Level 1 is essential to doing this.
You might be surprised by what you see. Maybe one of your channels generates a minuscule number of new contacts, but those contacts have higher levels of engagement with your content and are much more likely to ultimately convert.
By getting that step-by-step view of your funnel, you’re able to make more informed decisions about where and how much you spend on different marketing vehicles.
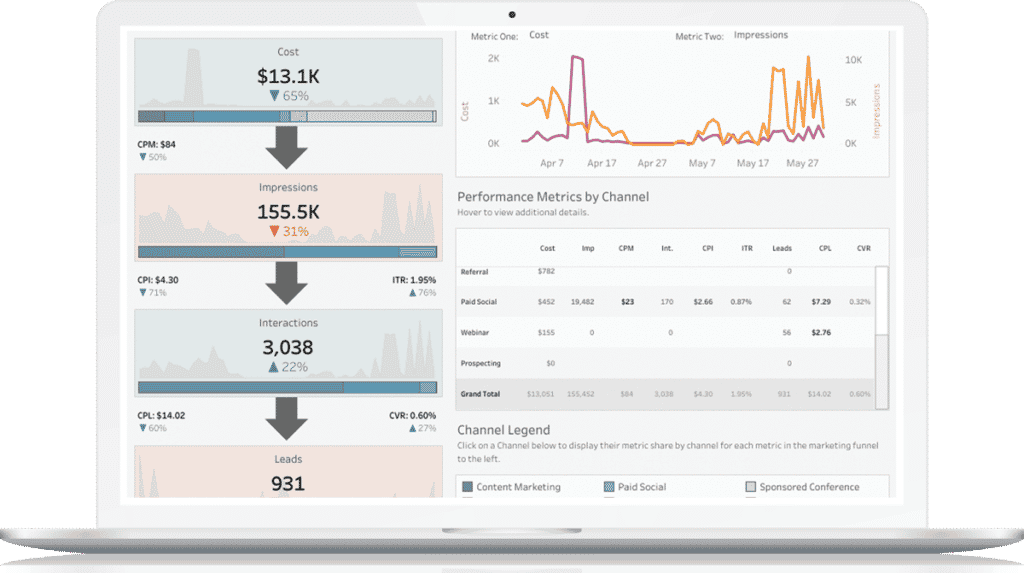
A marketing funnel gives you a step-by-step view of how your marketing spend is generating awareness, engagement and conversions.
Marketing & Sales Pipeline
Of course, marketing doesn’t exist in isolation — everything you do is ultimately supposed to create more business (i.e. more sales or more valuable sales) for your organization.
To gauge your effectiveness, you need to bring marketing and sales data together in one pipeline view, so you can see how much you’re spending on marketing, how many new leads or contacts that creates, and what percentage of those folks become MQLs, SQLs, Opportunities and Customers. (At least, that’s one way of organizing a pipeline. It’s possible you might have more or even fewer stages.)
This requires detailed sales data, the kind you find in a CRM. And like all your Level 1 data, it should be automated and unified, so you can monitor the health of your pipeline every day. Getting CRM data to play nicely with your marketing data can be a challenge. Some CRMs have iffy connections to analytics software. Or if it’s a custom-built CRM, there might not be a connection. You may need a data engineer to help you ensure a steady, reliable flow of data.
One benefit of building a sales-marketing pipeline? It’s possible for marketers to have data-driven conversations about their impact on the business and troubleshoot with the sales team if there are weak spots in the funnel. You might notice that everything goes swimmingly until a lead hits the SQL stage, where the dropout rate spikes. Knowing that problem exists, you can zero in and together look for potential fixes.
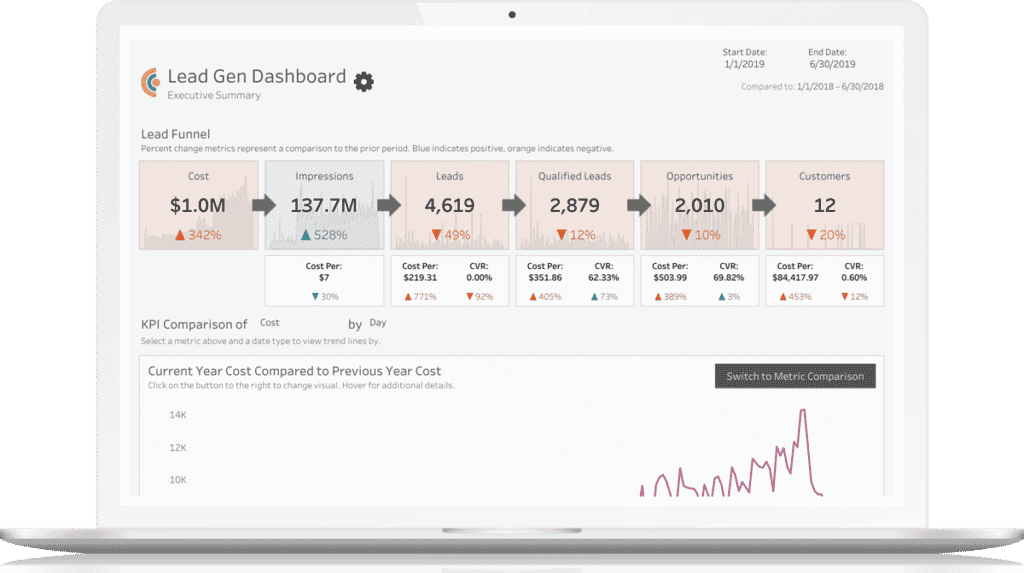
Having a combined view of marketing and sales funnels is the key to better alignment.
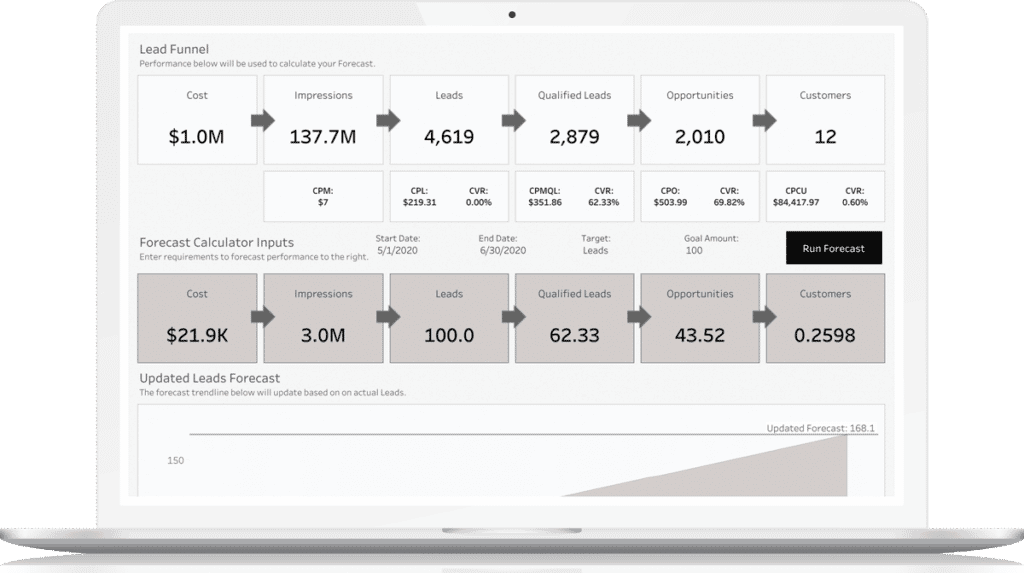
With the right data storage solution, you can have enough historic data to forecast results and set goals based on past performance.
Marketing & Sales Forecasting
Once you build that pipeline view, you can do something else that’s really cool: You can use historical performance data to forecast business outcomes based on your marketing spend.
If you know …
- How much marketing spend it takes to “buy” a contact
- What percentage of contacts ultimately makes a purchase
- How much the average purchase is worth
… it’s possible to assess how much new business you can expect based on a given level of spend. ChannelMix’s Lead Generation dashboard has a built-in forecasting tool for that purpose.
Level 4 | PREDICT
Use Predictive Analytics to Guide Marketing Strategy
And now you’re headed to the Promised Land, what most people imagine when they talk about marketing analytics: using data to predict the most effective way to spend budget and implement campaigns. Everything you’ve done has built up to this.
Customer Journey Modeling
At Level 4, with a custom attribution model, you can build a data-supported journey of the most common paths that contacts follow to becoming customers, along with the combination of marketing channels most likely to lead them to that point. You can also more easily spot the “dead ends” — the circumstances that are more apt to end with no sales.
If you can incorporate user-level data into customer journey analysis, you can use that knowledge to tailor your marketing automation or develop a more nuanced lead score.
Predictive Forecasting
You can estimate how many sales you’ll generate next quarter or how many conversions your upcoming campaigns will generate by applying statistical formulas or machine learning algorithms to your historical performance data. (Usually at least two years’ worth.) You can also incorporate other data into your predictive model, including weather, consumer sentiment, population numbers or other factors.
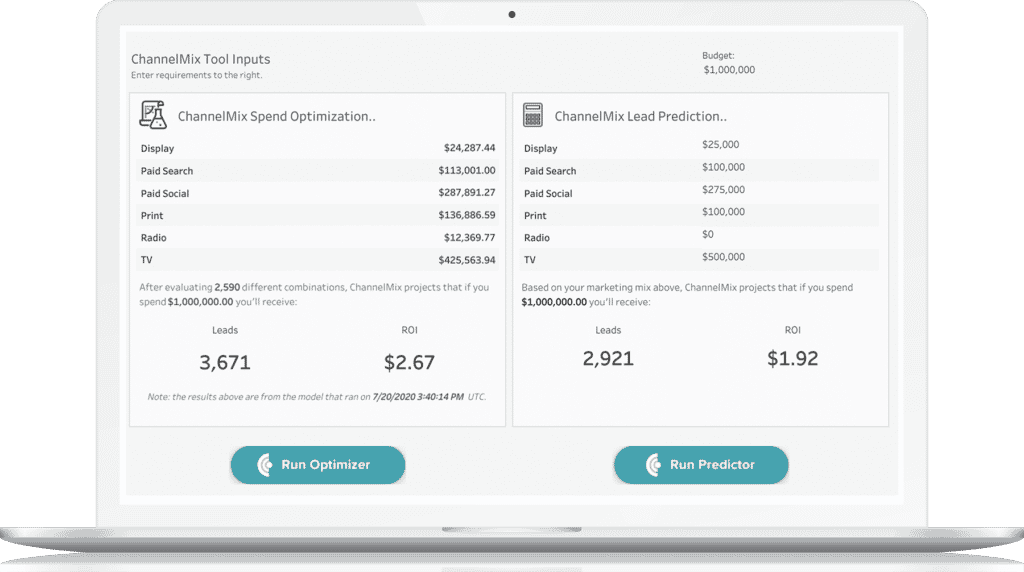
Media Mix Modeling
Sometimes predictive forecasting takes the form of media mix modeling where you can determine how much you should spend and in which channels in order to hit your predetermined goals.
It takes a lot of work to reach Level 4. You’ll require a significant amount of historical data — usually a few years’ worth — as well as a data scientist who can wield tools like Python and R.
The analytics Holy Grail is predictive modeling that shows you how to invest your marketing dollars to get the best possible outcome.
Reaching the Next Level of Marketing Insight
If you’re at Level 1 or 2 — or even if you’re at Level 0 — that’s OK. Most marketers are. It’s impossible to start at Level 4. Everybody goes through a process of gradually acquiring the skills and resources to produce marketing insights and reporting for each level of sophistication.
And you may find that you don’t really need to climb to Level 4. Case in point: If you’re a boutique agency that helps small businesses advertise on Google Ads or Facebook, you might be pretty successful with Level 1 or 2 reporting.
But if you do aspire to more, the Levels are a great way to diagnose where your capabilities currently exist and what you need to do to reach the next level.
Need Help Building a Successful Analytics Strategy?
ChannelMix’s analytics-as-a-service model gives you everything you need to produce game-changing insights and reporting, and that includes expert advice on structuring your analytics strategy and practice.