
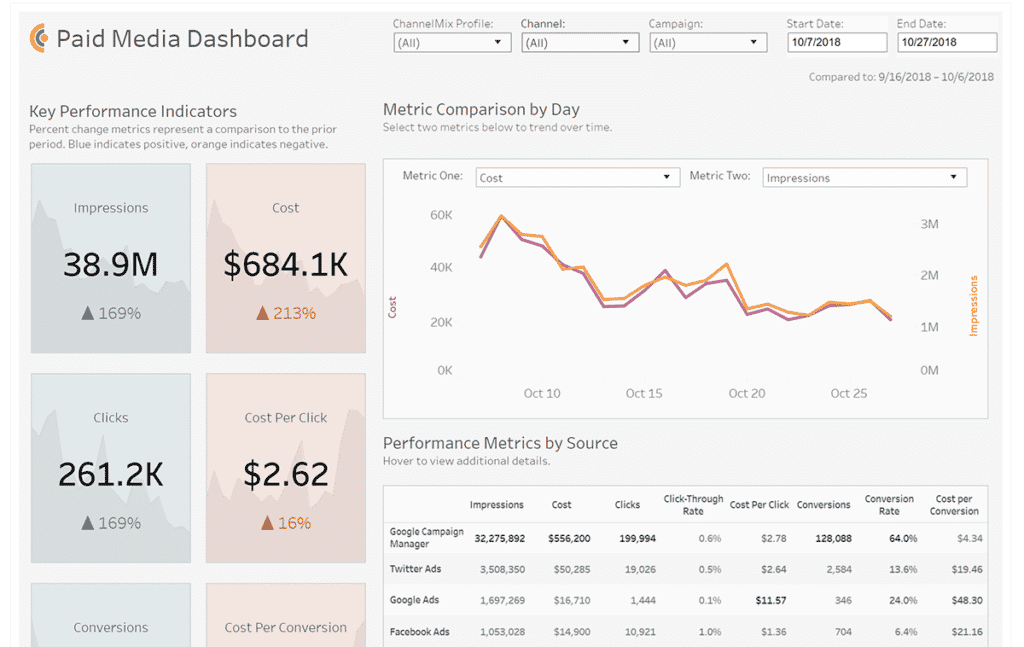
A marketing dashboard is a report that presents data on key performance indicators (KPIs) through a series of visualizations — bar graphs, pie charts, scatter plots, etc. That way, nontechnical users like your CMO or clients can easily understand what the data is saying and use it to make decisions.
What kind of data? Essentially any kind you choose: digital, search, social, TV, radio, print, OOH, display, email, web and beyond. And you can use them to track engagement, awareness, conversions, sales and all your other essential marketing metrics.
It’s called a “dashboard” because, like the one you have in your car, you can use it to observe your organization’s marketing performance in near real time. And that gives you the power to make in-the-moment course corrections as necessary. (Ideally, data is updated regularly — usually daily, if possible.)
A good marketing dashboard will use blended data. It will bring together data from multiple sources and combine it all in a way that gives you a holistic view of performance at the campaign or channel level. For example, instead of only showing individual results for Facebook, Snapchat, Instagram and Twitter, your dashboard might also display results for them all under the umbrella of “organic social.”
You can also build your dashboard to show how your performance stacks up against your goals or your past results, giving you useful context when making business decisions.
Put simply, marketing dashboards make marketing, media and sales data faster and easier to understand than, say, an Excel spreadsheet or a PDF.
What Are the Benefits of Using Marketing Dashboards?
Dashboards make data human-friendly.
Your company’s leadership, your clients — they’re all intelligent enough to open up a spreadsheet and, if they have time and sufficient amounts of caffeine, grasp what the data is saying.
But why make them suffer when you’ve got a better option to offer?
A dashboard makes it so much easier to comprehend what’s happening with your marketing, and it enables speedier decision-making. A great marketing dashboard will meet the 5-1-5 Rule. A user should be able to understand a visualization in 5 seconds, develop an insight within 1 minute and be able to make a business decision within 5 minutes.
And while marketing dashboards make data simpler to understand, they don’t necessarily dumb it down. Because of their interactive nature, a dashboard allows users to explore exponentially greater volumes of data and ask better questions, on their own, than a typical spreadsheet could.
Want to see the big picture? The dashboard will show you. Want to get granular? You’ve got the power to do that, too.
3 Benefits of Using a Marketing Dashboard
Faster, More Scalable Reporting
Regular reporting on marketing performance is a fact of life, especially for many agencies. You have to show clients or internal stakeholders how their investment in your services is performing.
Dashboards are a more visually appealing way to communicate that information to clients than a spreadsheet or a PowerPoint, which usually aren’t interactive or nearly as flexible as a dashboard is. And once the dashboard is up and running, it will automatically update with new data as it becomes available — something a PowerPoint can’t do. You don’t have to spend the last few days of each month racing to build reports. And it puts more power in your end-user’s hands to make up-to-the-minute decisions about advertising budgets.
Dashboards are also more scalable. Once you have constructed your basic dashboard, you can quickly duplicate it and, with a few adjustments, use it for other audiences. This is an especially useful point for advertising agencies with dozens or hundreds of clients. Or for franchises that handle marketing and media for large networks of franchisees.
Advanced Insight
Not that you have to stop with your monthly dashboard. You can also create more advanced dashboards that are designed to solve specific business problems.
Case in point: Maybe you want to build a dashboard with a built-in calculator for determining where, when and how much to spend on advertising. That calculator — drawing on your historical performance data — can give you a better idea of what results your spend will create, based on what occurred in previous years.
Increased Accountability = Increased Revenue, Retention and Budget
Marketers face increasing calls for accountability. The people cutting the checks want to make sure that budget is contributing to the business’s overall success.
For brands, a good dashboard will demonstrate the value of marketing and make it easier to make the case for next year’s budget. It could also give your marketing team a louder voice in your organization’s overall business strategy, if your insights lead the company to develop new products or pursue new audiences.
For agencies, your dashboard will do a better job of showcasing the ROI you’re creating for clients or stakeholders. That will give you a stronger argument for retaining those clients. And you absolutely can (and should) charge for more sophisticated dashboards.
How Do I Create a Marketing Dashboard?
There are a wealth of tools that can be used to build marketing dashboards, from best-in-class visualization solutions such as Tableau or Looker to entry-level software like DashThis. Some of these offer simple drag-and-drop interfaces while others take more time to fully learn.
But learning the software is only part of the battle. You’ll also need to master best practices for designing visualizations that communicate clearly and effectively.
Alight Analytics offers two ways that marketing teams can get up and running with dashboards faster.
> Our suite of Marketing Dashboard Templates for Tableau. These templates need to be connected to just one data source — our ChannelMix platform for marketing data aggregation. They deliver advanced, channel-level reporting without requiring you to spend weeks building out your own dashboard.
> Our marketing analytics services team will work with your team to build or co-build a marketing dashboard with you. Your team can draw on the experience that our team has developed over 12-plus years.
Got Anything Else for Me?
Actually, we do. If you want to learn how to build marketing dashboards that don’t suck, check out our eBook!