Tableau or Microsoft Power BI — which analytics platform is better for marketing teams that need to create data-rich dashboards and actionable insights?
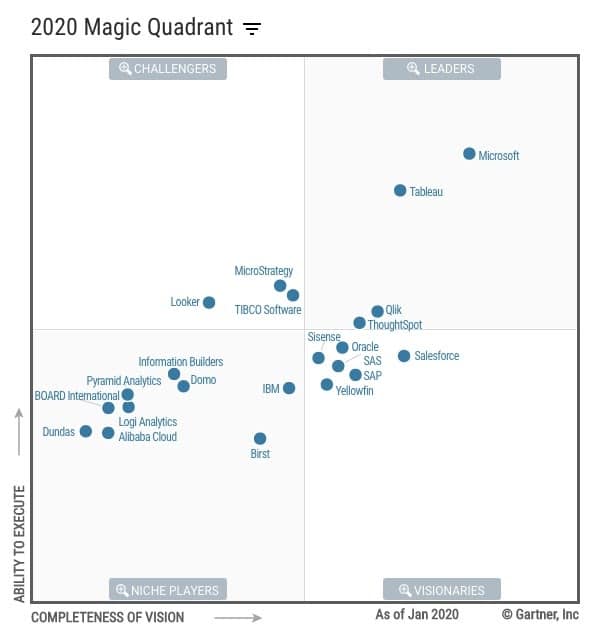
Here’s the good news: You won’t go wrong if you pick either tool. Each one offers robust features and functionality that help marketers to better understand and use their data. They’re literally the industry leaders, according to Gartner’s Magic Quadrant for Analytics and Business Intelligence Platforms.
But Power BI and Tableau aren’t identical twins, either. Both have unique characteristics that could make them a better fit for your particular team. Let’s break it down.

Tableau Benefits and Drawbacks for Marketers
User Base and Market Presence
Tableau has been in the marketplace about 10 years longer than Power BI, so it’s developed a large and loyal following among analysts, viz specialists and others who spend a lot of time building marketing dashboards. That large user base is pretty handy if you need to hire someone with Tableau-specific skills or you need to ask the user community for help solving questions.
Powerful, Flexible Visualization
One reason why all those people love Tableau? Tableau is constantly enhancing and adding to its already sophisticated feature set. If you have something specific you want to build in Tableau, you can almost always find a way to execute your vision. It’s possible to create beautiful, on-brand visualizations — something that many marketers appreciate.
Streamlined Data
There are also several ways that Tableau streamlines many data-related tasks. For example, our team has found that it’s easier to create level of detail (LOD) expressions or combine multiple datasets with blends in Tableau. You can do similar work in Power BI, but it might require you to be more familiar with DAX, Power BI’s language for formula expressions. Tableau’s parameters also tend to be more flexible than their equivalent functions in Power BI.
Potential Concerns
Recently, Tableau became a part of the Salesforce family of applications, alongside tools like Datorama and MuleSoft. That could be a good thing, but also a challenge, Gartner noted: Salesforce could boost Tableau’s performance with cloud, AI and embedded analytics, but there may be growing pains, at least in the short term.
As an enterprise-class solution, Tableau also requires an investment of time and budget. Unless they already have Tableau experience, your team will probably experience a learning curve as they start using the platform — they may even need dedicated training. And you could likely find competitors who charge less than Tableau, though for an offering that isn’t as fully featured.
How does Tableau stack up against Google Data Studio? Check out Alight’s rundown here.
Power BI Benefits and Drawbacks for Marketers
Seamless Microsoft Integration and Affordability
While it’s a little younger than Tableau, Power BI enjoys widespread adoption. That’s partly because it’s part of the larger Microsoft family of products, and it works extremely well alongside Excel and other applications. For marketing departments whose companies already run on Microsoft, Power BI may be an easier way to get started with (and support) data visualization.
The price is right, too: Power BI’s Pro version is part of the Office 365 E5 package, and it can also be purchased as a stand-alone offering for $9.99 per user per month.
Impressive Visuals and User-friendliness
But Power BI is also popular because it’s an effective, generally user-friendly tool for creating reports and visualizations. As Gartner notes, an upgrade in 2019 greatly expanded the cloud-based version’s capabilities, especially when it comes to AI and machine learning. Power BI is constantly improving its offering, releasing monthly enhancements.
Tableau might provide a greater ability to customize visualizations — something that different Power BI reviewers wished for — but most users have praised Power BI’s ability to quickly create graphs and charts. That’s a huge benefit for time-strapped marketing teams that don’t have dedicated resources for building reports. Our team has also been impressed by Power BI’s bookmarks, which let you save different visual states, and its buttons, which make it simple to toggle between multiple items in a visualization.
Easy-to-Use Data Modeling
Our experts also like Power BI’s Power Query, which gives users the power to quickly add additional modeling to a dataset. You can easily add new columns based on logic, rename or format columns, or merge or append datasets. (Tableau offers similar abilities, though this functionality is available in limited capacity in its Data Source tab. To achieve more robust functions, you will need a secondary application, Tableau Prep.)
Potential Concerns
What are the drawbacks to using Power BI? Though Power BI has an array of connectors, Gartner noted there may be some issues with connectivity. Its on-premises data gateways, for example, sometimes have “variable” query performance.
Power BI vs. Tableau — Who Wins?
Because the two platforms are so evenly matched in most ways, it really comes down to Power BI’s scale vs. Tableau’s specialization and which one matters more to you.
Is a budget an overriding concern? Does your organization rely primarily on Microsoft products? Power BI might be a better option.
Will most of your reports be created by dedicated team members who are doing more advanced forms of visualization? You might be happier with Tableau.
One last piece of advice: Think about where you want your analytics program to be not just one year from now, but three years down the line. Obviously, we all have problems and challenges that we need our software to solve now, but adopting a new platform should be considered a long-term investment — nobody wants to constantly switch between tools. Choose the tool that will empower your team over the long term.
Take Your Marketing Dashboards to the Next Level
Alight Analytics offers a full suite of next-generation analytics solutions featuring plug-and-play dashboards with automated data workflows and built-in attribution and forecasting. Request your free 30-day trial!
Need help getting up to speed with Tableau? Alight has created a suite of training options built for marketing teams.