At Alight, we use Tableau Server – branded Channelmix.com – as our client reporting portal. This works wonderfully for getting data to our clients, but they may need it in another form for further distribution to their customers. Here are some pointers for getting data out of Channelmix for use in other presentations or analysis.
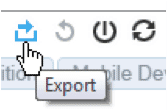
At the top of each dashboard, there is a series of symbols. The leftmost is the Export button:
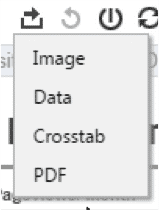
Clicking on Export gives you four options:
Each is explained in a section below.
Note: If the Data and Crosstab options are disabled, you must clock on the chart or table you want to export.
For demonstration purposes and sample files, I used this public dashboard on the internet.
Image
Result: Image file
Example Usage: You might use this to embed the dashboard in a Powerpoint presentation.
Selecting Image causes the server to generate an image file (png) of the Dashboard. This may take a few minutes depending on the complexity of the dashboard and the load on the server. When it’s complete, you have the option to download the file to your computer.
Data
Result: CSV file; machine readable
Example Usage: You might use this to get the data into another tool (e.g. Excel) to do further analysis or change how it’s presented.
Unlike Image, you must select (click) the data you want to export before using this function. The selection can be an entire chart or table or part of one. If selecting an entire chart or table, it’s not always obvious what you’ve selected – try clicking on a data point in the viz then click it again to deselect. After you select a Data export, you’ll be presented with a popup window containing a tabular view of the data you’ve selected. You can see the Summary data (the data comprising the view) or Underlying (all the data used to generate the view). Click Download to save as a comma separated value file (CSV).
Crosstab
Result: CSV file; human readable
Example Usage: You might use this to reproduce a table in Excel to further filter or modify.
This is similar to a Data export, but organizes the data in a crosstab (across the sheet) to make it more easily understood by humans. Even so, only simple or specially designed tables and charts will export to crosstab effectively.
Result: PDF file
Example Usage: You might use this to e-mail a dashboard to someone.
This is similar to an Image export, but a PDF file is generated that you can save locally.


