Good data quality is the foundation of your marketing dashboard’s success. It doesn’t matter if you build a beautiful dashboard, deliver a great user experience and tell a cool story with the data — if your audience doesn’t trust the data, they’ll stop trusting you.
Data quality issues crop up when a process has multiple human inputs. SQL and Tableau always do what they’re programmed to do. Humans, though, are a little less perfect. Even high-quality developers and analysts will fail at least 1 percent of the time.
That failure rate can compound over time because there are so many opportunities for us to make mistakes, from writing a SQL script to inputting simple parameters. Add in the complexity of whole organizations, all filled with countless humans contributing to the data in other ways, and it’s easy for data quality to diminish.
Prevention is the best policy for handling data quality issues. However, that’s easier said than done. It takes a proactive effort from management, developers, analysts, and the stakeholders.
Common Prevention Methods for Improving Data Quality Include:
- More thorough requirements gathering. Spend extra time with your stakeholder to clearly define the rules surrounding your data and how the report should translate it. Make sure these rules are simple and intuitive. That makes it easier to implement, as more complexity makes marketing data solutions more brittle.
- Close collaboration with stakeholders that contribute to strategy implementation (Paid Media Managers, Social Media Managers, Account Executives, etc.). Do not wait to consult with contributors until after you have designed and built the dashboard. Their buy-in to the solution is crucial, especially if they’re expected to change their own processes to support it.
- Overcommunication on expectations regarding data inputs (Google Sheet data entry, campaign structures, UTM parameters, etc.). The importance of proper campaign naming structures and UTM parameters may be clear to you, but they’re not always obvious to the people responsible for implementing them. Sending clear documentation and spending an hour explaining in person why these process are important makes it easier for people to see the value in the tedious details.
- Scheduled time for quality checking. Don’t delegate the responsibility of quality checking to the developer or analyst who built the dashboard. Make it a scheduled task and an expectation from management. When this time isn’t scheduled, it’s easy for a developer’s coworkers to have their calendars filled with other work, thus turning what should be standard operating procedure into a burden.
As you can tell, these prevention methods are simple. The reason most organizations have trouble implementing them is that they take time. This is especially true for marketing agencies, since being nimble and quick to act is a hallmark of their success. It also takes active leadership – both from the managers of the analytics teams and the managers of the contributing teams – to enforce these expectations.
So That’s How You Prevent Data Quality Issues. How Do You Spot Existing Ones?
There are many methods for identifying data quality issues. A statistician or data scientist can use statistical analysis to identify outliers in data flow or metrics. A quality assurance person can audit existing builds to see what falls outside compliance.
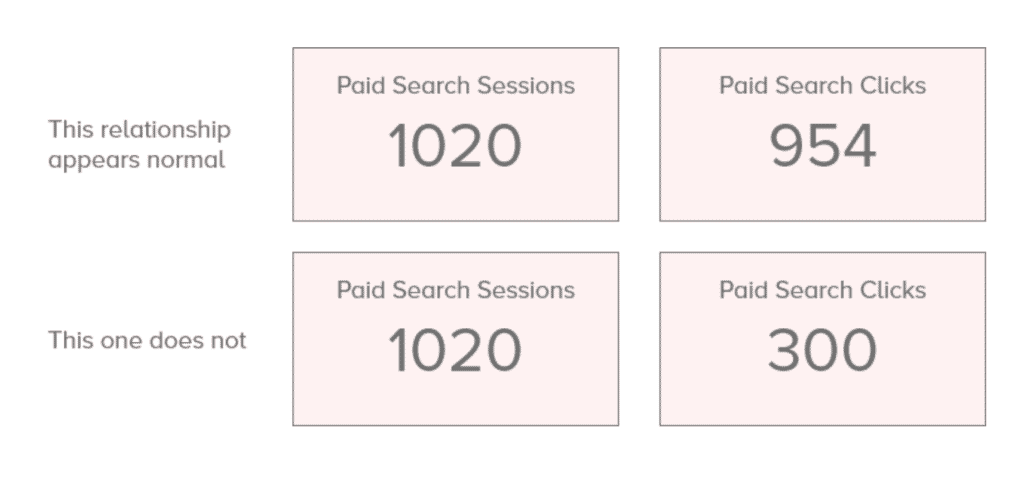
But the most efficient way is a simple rule of thumb I found in marketing metrics – a click causes a session.
If we know A causes B, then we’d expect the existence of B to imply the existence of A, and vice versa.

That relationship is particularly true for clicks and sessions. Typically, a click on a display ad, paid search ad or an email link leads to a session on a website. It usually is around a 1:1 relationship. (It’ll never be exactly equal, though.)
So if you open up your marketing dashboard and see 1,000 sessions from your entire display channel, but only see 300 clicks on your individual display campaigns, you have data quality issues. Those issues could be improper naming conventions, incorrect UTM parameters or missing API connections. It could also mean the logic in your report calculations are off.

It’s important to get your clicks and sessions right, because an inaccurate click or session count usually means other metrics are wrong. If you’re not pulling in all your clicks, that means your cost is probably wrong, too. So is your cost per conversions!
When it comes to both Paid Social and Owned Social, it’s important to use this rule of thumb more carefully.
Facebook Ads default clicks do not refer to link clicks. They’ll count a click to play a video as a click. It’s important to make sure the clicks you’re using in a marketing dashboard are link clicks before using this rule of thumb. The relationship between a Facebook Ad link click and sessions is generally 1.5:1.
And you should rarely use this rule of thumb with your Owned Social. Many of the links on your social media posts won’t direct your users to your website, so they’re not a good barometer for data quality.
One Last Piece of Advice: Go Easy On Yourself
Quite often, looking into data quality can make people feel like they haven’t been doing their job. Humans are human. We all make mistakes some of the time. As you work harder to fix these issues, know it is not a reflection on you or your team. It simply takes time and attention to detail to improve data quality in the long run.
After you implement better process control, do more thorough requirements gathering and increase time quality checking, don’t be embarrassed or frustrated with the occasional bug that comes through. You’ll never get rid of them completely.
Looking for Help With Marketing Dashboards?
Alight’s analytics solutions come with a suite of ready-to-use dashboards. See them in action – schedule a demo with our team!
