Ever put a field onto a shelf on Tableau and wondered why it didn’t work like you expected? One reason could be because you dropped a Green field when you wanted a Blue one – or vice versa.
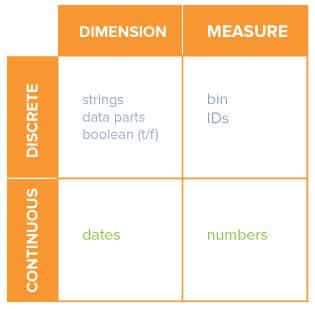
Most people know there are two types of fields in Tableau: dimensions and measures. Dimensions are Blue and Measures are Green, right? Actually no. The Blue and Green colors don’t indicate the type of field, they tell you how Tableau will use the field. It just happens that dimensions are usually Blue and measures are normally Green.
When you drop a field onto a shelf, you can choose how you want Tableau to use the field. Blue means Tableau treats it as a list or category; in other words, it’s discrete. A Green field represents a range of values: i.e. continuous. Think of a Blue field as a car – there are different models you can choose between. A Green field might represent your speed in a car – the values represent a continuous range and flow from one to the next. You might use a discrete Blue field to populate a dropdown menu or list of values (choose a car model), while you could sum or average a continuous Green field (your average speed).
There are many reasons you don’t get the results you expect in Tableau, but I’ve seen this happen a lot with new users. When you add a field to a worksheet, always remember to check its color!