Data silos are one of the most persistent and frustrating challenges that marketers encounter because silos make it immensely harder to optimize campaign strategy and tactics.

A silo is when data from a specific source is kept separate and isolated, making it more difficult or even impossible for other users to access.
This usually happens because different teams are using technology or taxonomies that don’t work together, so it’s harder for them to share data. Or there’s something about the data that requires it to be protected — for example, customers’ personally identifiable data.
And of course, sometimes silos occur because some people just don’t like sharing.
It’s easy for data silos to develop in larger enterprises where each team or division chooses its own framework for collecting marketing data. Your social team might use tools and metrics that don’t align with your media-buying group.
Or maybe your company hires different agencies to manage different pieces of its marketing strategy. One might oversee your search while another is responsible for all your social outreach.
Why Data Silos Are a Problem for Marketing Teams
Whatever the cause, data silos are a problem for marketers because they limit your ability to assess marketing performance holistically.
We live in an omnichannel world, and your customers will encounter your brand on multiple platforms — email, TV, social media, search, OOH and beyond. Most of the time, a single message isn’t going to create a conversion on its own. Rather, each platform works together to attract and influence your audience.
So it’s not enough to know how many conversions your Facebook Ads created. You also want to see how all your paid social (Twitter, LinkedIn, Snapchat, etc.) performed, and how that compares to other channels like organic social, paid search, display and more. How did your last campaign perform? Not just the individual data sources, but all of them working together?
Once you understood that, you can direct your time and money to the tactics that really produce ROI.
The Secret Cause of Data Silos: Bob
When your data is siloed, answering questions about marketing performance is harder. One, because simply getting your hands on the data is a pain in the neck. Bob’s too busy to send you the spreadsheet this week. How’s next month? (Not great, Bob. It’s not great.)
And when Bob finally deigns to email you the data you need, you’ve got another challenge ahead of you.
His data isn’t set up like your other datasets. He’s using dimensions that you don’t, and vice versa. Or he’s got some of the same dimensions, but he calls them something else. His dates are written in Martian.
Which means you need to union or blend all the datasets together. If you’re stuck doing the job by hand, it’s going to be frustrating, time-consuming and error-prone.
How Marketers Can Break Down Data Silos
There are solutions you can use to automate a lot of this process, like our ChannelMix platform for marketing performance analytics. It can bring together data from any source of marketing, media and sales data. Our data strategists work with you to normalize dimensions and taxonomies so that all your data sources will speak the same language.
ChannelMix produces OneView datasets — a special type of dataset that unites multiple data sources in a single view. Users can see the performance of an entire channel or campaign, while retaining the ability to look at results for an individual data source or any other level of granularity.
To see the difference that OneView makes, take a look at the Paid Media dashboard template that our team created for Tableau users.
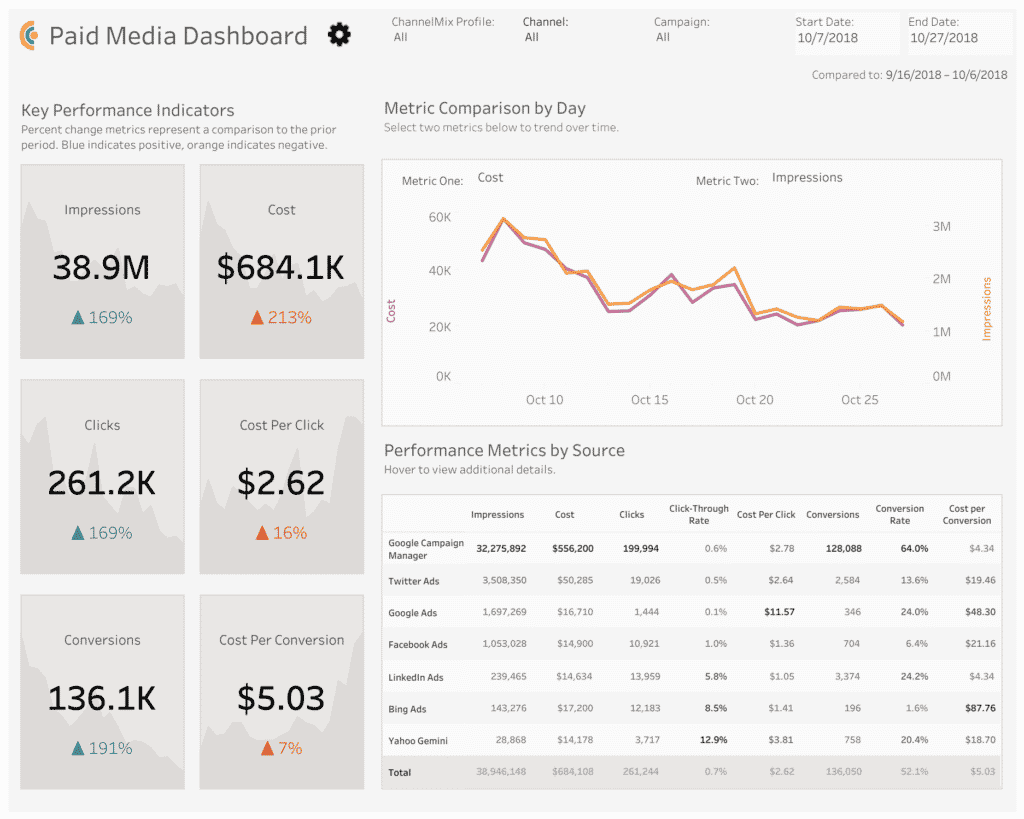
The visualization is powered by a single OneView dataset that incorporates all of a user’s paid outreach, including paid search, paid social, display and online videos.
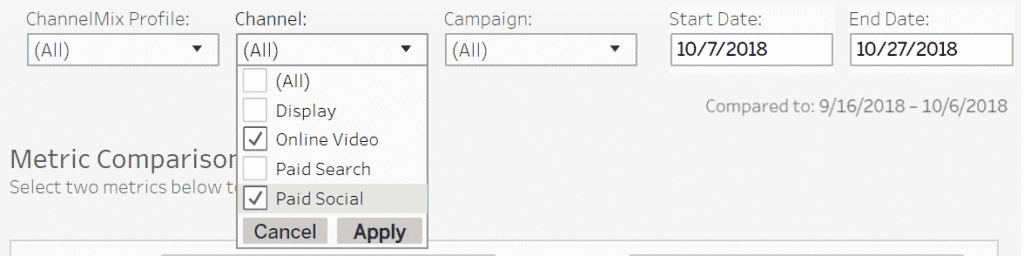
Using the dropdown menus in the top right corner, you can choose to look at the performance of all your channels at once, or you can focus on individual sources.
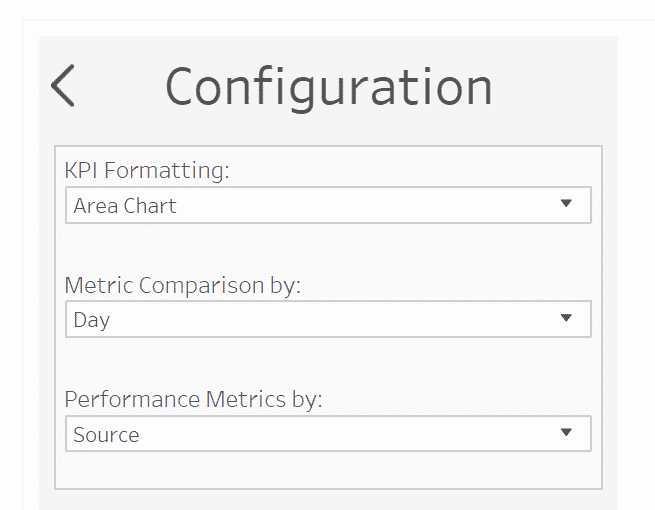
You can even control the timeframe of your dashboard. Click the gear icon, and you’re taken to a Configuration pane that allows you to set the Metric Comparison box’s timeframe to day, week, month or quarter.
It’s all possible — and effortlessly so — because the data was set up correctly from the start.
Data silos are a major obstacle for marketers looking to better understand and optimize their performance. But with a little work, and the right strategy and solutions, they can be overcome, giving you a greater insight into how your marketing efforts are really performing.
Looking for Help With Marketing Dashboards?
Need an advanced dashboard quickly, but don’t have the time to build it? Check out Alight’s suite of Marketing Dashboard Templates for Tableau. These ready-to-activate templates — for paid search, paid social, paid media, organic social and web analytics — effortlessly bring together multiple data sources in analysis-ready datasets, courtesy of ChannelMix OneView. Contact our team to schedule a demo.
Our professional services team can build or co-build a marketing dashboard with you, the way we have for some of the nation’s leading brands and agencies. Let’s talk!