
When you’re building a dashboard, one of the most critical — and toughest — steps is choosing which marketing KPIs to include in your visualization.
If you’re like most marketers, you probably have a massive amount of data that you could display. It can be tempting to squeeze as much information as possible into the dashboard. In fact, you might even have a boss or client asking you to do just that.
But the best marketing dashboards make it as simple as possible for your audience to understand and interact with their data. Overwhelming your end-users with dozens of different KPIs? You’re only going to make it harder and more frustrating for them to find what they need.
That’s why it’s important to do the hard work of narrowing down the marketing KPIs that you’ll showcase. Here are some of the questions that our team asks when we help clients construct their dashboards.

Who’s Going to Use This Dashboard? What Questions Are They Trying to Answer?
Emphasize the “key” in KPI. What information do your end users really need to do their jobs?
That’s going to vary depending on who’s using the dashboard. Your company’s leadership team may want a broad overview that focuses on a handful of key “scoreboard” metrics, like clicks or conversions. They want to know, at a high level, if a channel like search is delivering ROI.
But your search channel manager probably needs to take a more granular approach, so they can spot specific problems or opportunities. That person might require a dashboard that looks at individual ad groups or keywords. Which ads or keywords are underperforming or overperforming?
You could solve this problem by creating a couple of dedicated dashboards — one that offers an executive summary and another dedicated to search.
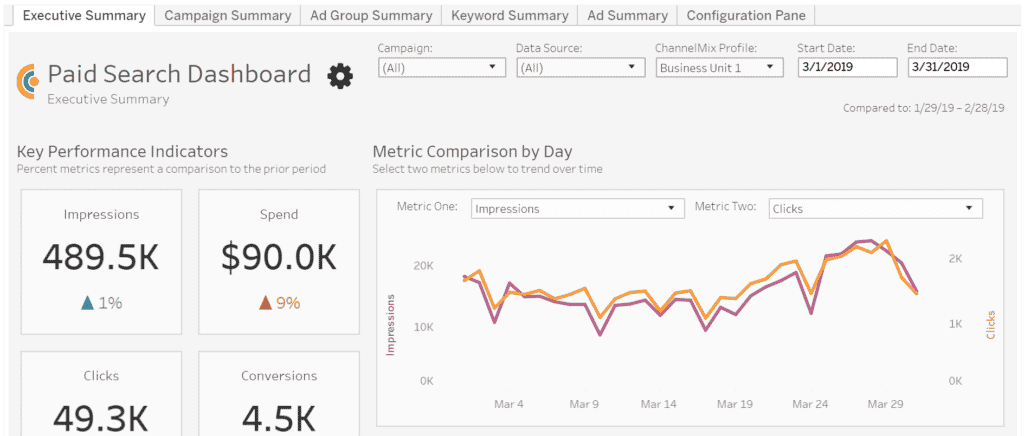
Or you might decide to develop a single dashboard with multiple tabs, each devoted to a different purpose. Our Paid Search dashboard is a good example of this. The first tab gives a high-level view of search performance, but you can also dig deeper into ad groups, keywords or ad creative by going to a different tab.
It’s always a good idea to have a conversation (or several conversations) with your end users so you have a clear idea of what they need. Spend time thinking and talking about the business questions they’re trying to answer.
Will These Marketing KPIs Help Me Make a Decision or Take Action?
A good marketing dashboard will help your end user understand their performance so they can make better decisions about which tactics to use or how much spend to allocate to a campaign.
Not every KPI facilitates action. Let’s say you’re an online retailer who’s trying to increase sales. Impressions may not be as useful to you as cost per conversion or conversion rate. Ratio-based KPIs like those tend to be some of the most powerful metrics that marketers can track.
Of course, it all depends on your team’s goals. What if, instead of trying to boost conversions, you’re trying to increase awareness of a new product? In that case, impressions will be pretty important.
Does This Marketing KPI Put My Performance in Context?
A KPI is more useful if you can compare it to past performance, industry benchmarks or company goals.
It’s not enough to know that my company sold 1 million units last month. But if I learn that 1 million is twice as much as I sold a year earlier, that’s pretty useful. Or maybe 1 million units is 200,000 short of what our company was expecting. That’s good, actionable information to possess.
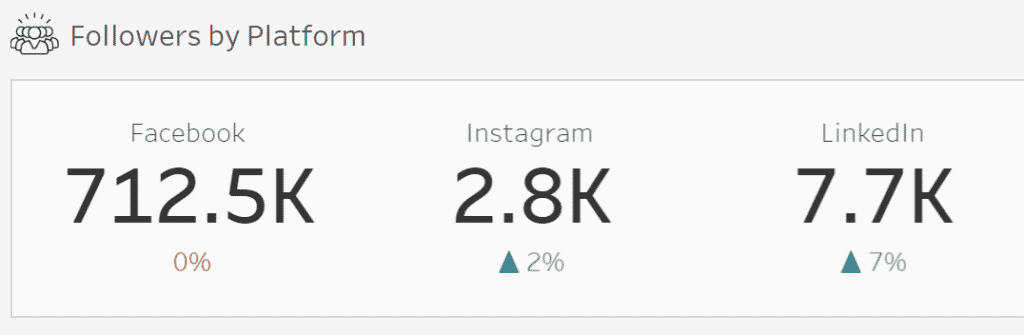
There are several ways to add context to your KPIs, like trend charts. Our team built an Organic Social dashboard that tracks the number of followers by platform. Under each metric, you can see the percentage change compared to the previous time frame. It’s even color-coded — teal for a positive trend, reddish-orange for a possible negative trend.
Is This Marketing KPI Actually Measurable?
Asking a good question is only half the battle. You’ve also gotta have the data to answer it.
For example, it might be interesting to know how your daily sales stacked up against your 10 biggest competitors over the last 20 years. But unless you have a data source you can use to answer that question, it’s not a KPI you can really measure in your dashboard.
Or you might face a situation where you could theoretically get the data you need, but doing so would be more trouble than it’s worth. Maybe you’ve got the data … in a storeroom full of old paper records that will take your team a year to manually add to a spreadsheet.
How Often Do You Need to Monitor That KPI?
Marketing dashboards are designed to give up-to-date readings on your most important metrics, so you can make adjustments ASAP. But there are some situations where a dashboard isn’t the best place to track that information.
Case in point: Let’s say you’re running a campaign to influence public opinion, and you’re monitoring response via surveys. A daily tally of responses won’t be as useful as a comparison of public sentiment before and after the campaign — something that’s better shared via a static report instead of a constantly updated dashboard.
It might take a little time to identify the right marketing KPIs for your dashboard, but it’s an investment that will pay huge returns for the people using the visualization. Understanding exactly what they need will enable you to create a more powerful, more focused visualization, one that your audience will love.
Looking for Help With Marketing Dashboards?
- Need an advanced dashboard quickly, but don’t have the time to build it? Check out Alight’s suite of Marketing Dashboard Templates for Tableau. These ready-to-activate templates — for paid search, paid social, paid media, organic social and web analytics — effortlessly bring together multiple data sources in analysis-ready datasets, courtesy of ChannelMix OneView. Contact our team to schedule a demo.
- Our professional services team can build or co-build a marketing dashboard with you, the way we have for some of the nation’s leading brands and agencies. Let’s talk!