
Marketing dashboards are a potent way to monitor and assess marketing performance, but many of these visualizations aren’t as effective as they should be. And it’s all because of siloed reporting.
Siloed reporting is when a dashboard displays metrics and KPIs for individual data sources separately, but never combines them to illustrate their impact at the channel level.
A channel is a grouping of similar data sources. For example, your organic social channel might show your engagement results for Facebook, Twitter, LinkedIn, Snapchat and Instagram. The paid search channel would encompass data from Google, Bing and other search networks.
Channel-level reporting on marketing performance allows you to determine, in one view, whether your investment in a broader category like social or search is generating ROI. That way, you can increase or decrease spending.
The Best Marketing Dashboards for Reporting on Channel Performance
Alight Analytics recently launched a suite of five Marketing Dashboard Templates designed for this type of reporting. They’re easy to use — just open the template in Tableau and establish a single connection to our ChannelMix marketing data aggregation platform. Each template draws on blended datasets created with our ChannelMix OneView technology.
The following are some of the best, most useful frameworks for marketing teams that are getting started with channel-level marketing analytics and reporting.
Paid Media
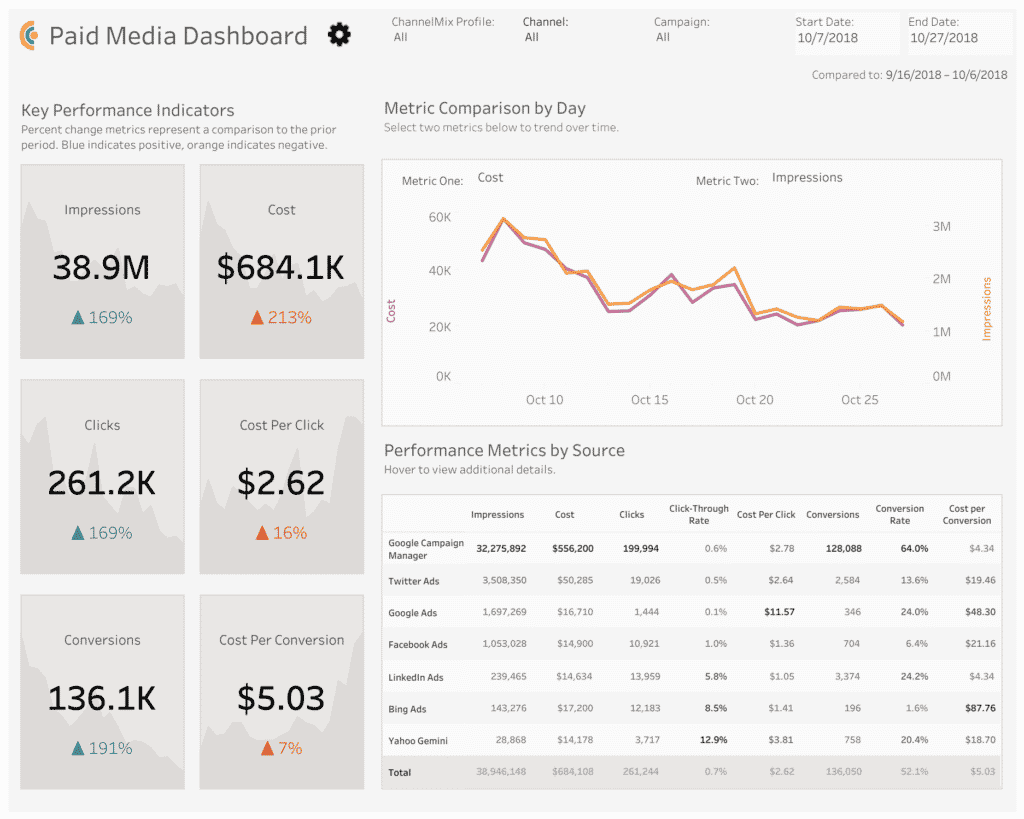
The Paid Media dashboard unites data from all your paid sources (including search, social, digital and display) in a single view. And that gives you the ability to see how each channel stacks up against the others.
It’s possible to view overall performance for impressions, clicks and conversions, as well as cost, cost per click and cost per conversion.
This dashboard gives users the power to filter results by business unit, channel, campaign and date. And while a channel-level view is important, so is the ability to study individual data sources — which is something you can do with this template.
Paid Social
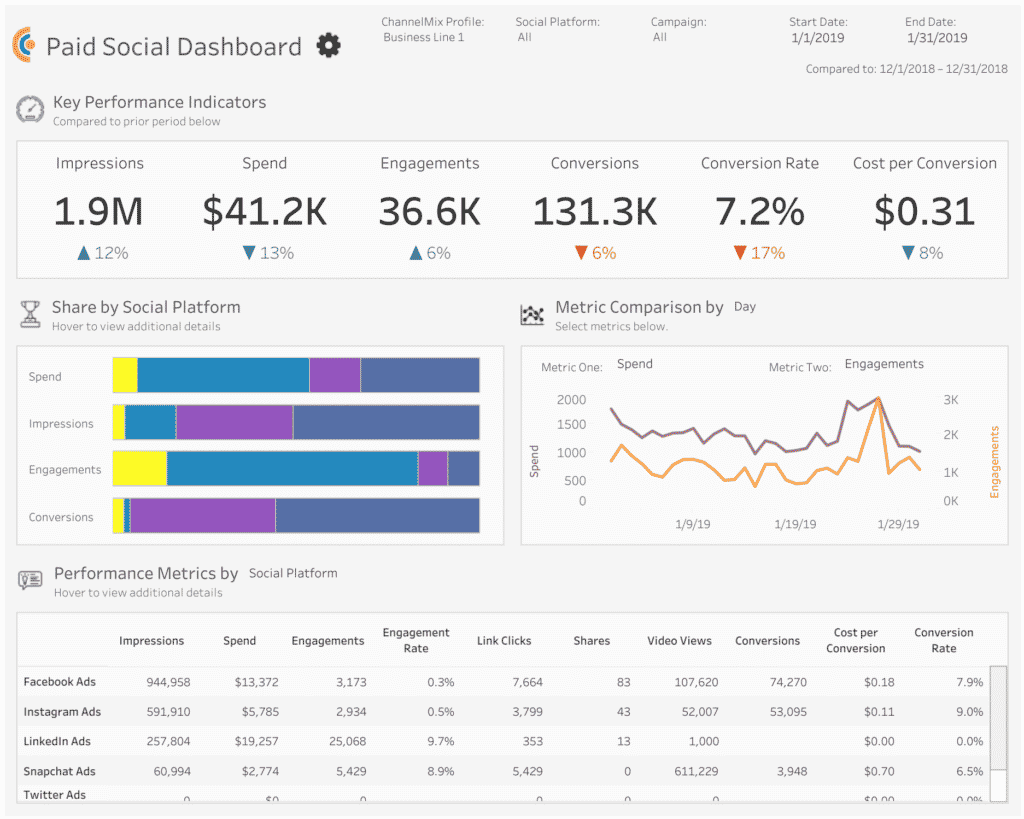
The Paid Social dashboard demonstrates how your spend on social platforms like Facebook, Twitter, Snapchat, Instagram and LinkedIn is performing. It measures impressions, spend, engagements, conversions, conversion rate and cost per conversion at both the channel level and for individual data sources. It also makes it easy to see how much each network contributes to overall performance compared to the others.
Organic Social
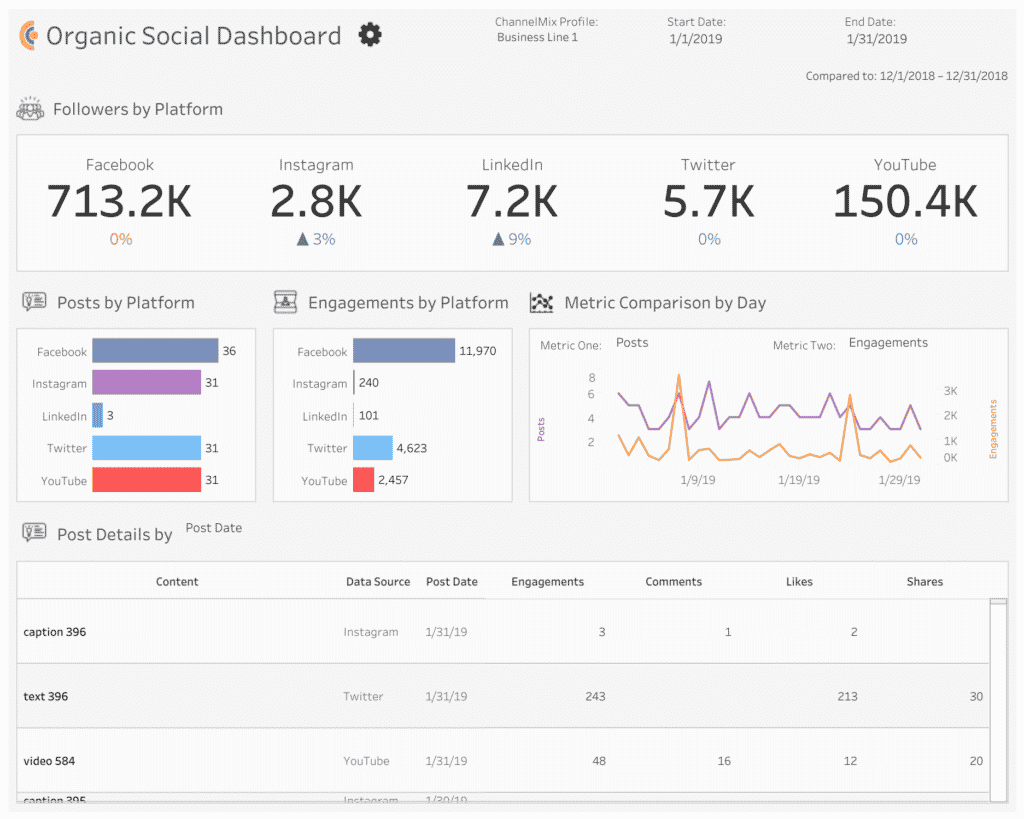
The Organic Social dashboard, meanwhile, illustrates performance for all of your unpaid social media activity. Users can view organic engagement source by source, or blended together for a channel-level view.
The focus here is on engagement — the sum of comments, likes, shares and other activity. (Though the dashboard also shows exactly how many of each you generated.) You can filter by date and line of business.
It can also be helpful to create separate tabs for individual social networks. That gives you the power to illustrate metrics that are unique to each platform, such as video views on YouTube and retweets on Twitter.
Paid Search
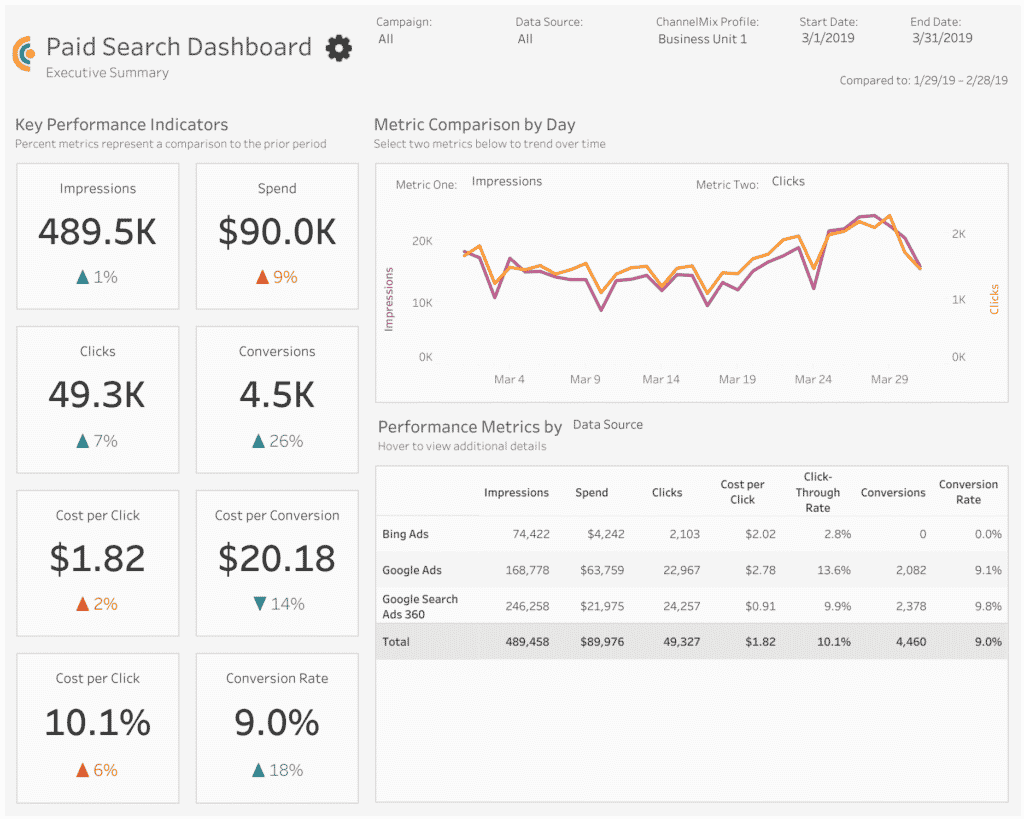
The Paid Search dashboard provides users with a high-level look at the performance of paid efforts on Google, Bing and other search networks while also giving them the capacity to examine results by campaign, network, device or ad group.
The most important metrics to track are impressions, clicks, cost per click, cost, conversions and cost per conversion.
Because keywords and ad groups are a critical part of paid search campaigns, the dashboard includes dedicated tabs where users can explore detailed lists for each.
Web Analytics
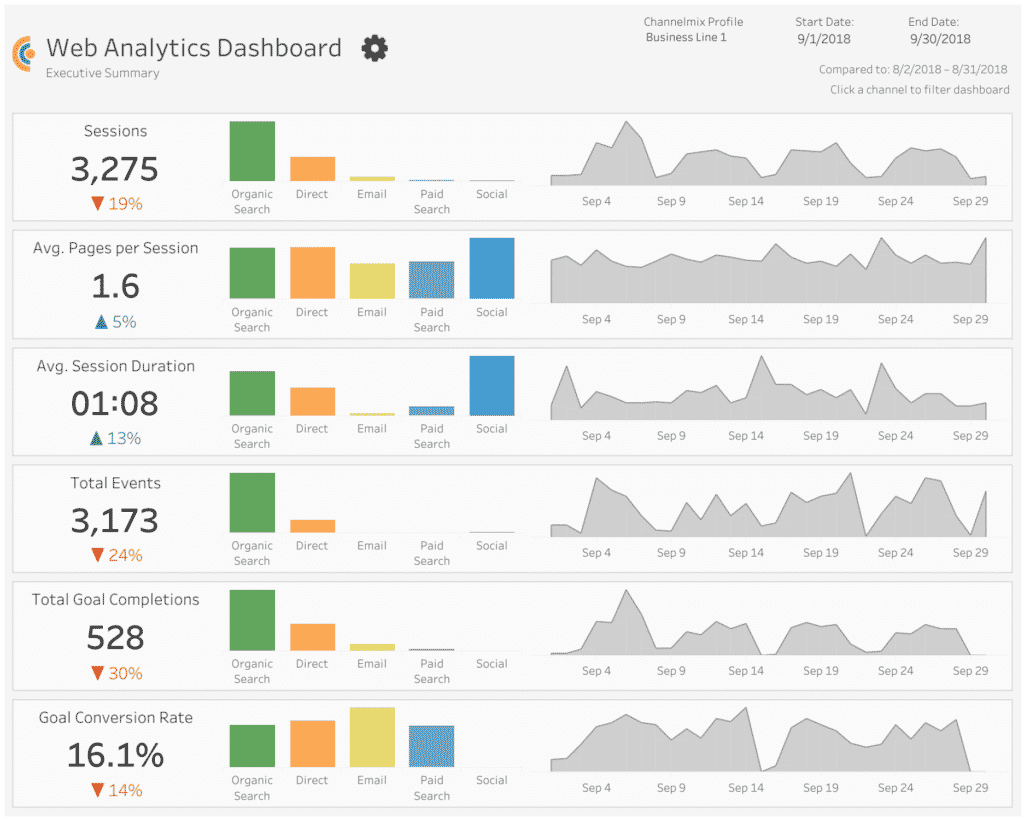
Your website is a central hub for your marketing efforts, one that receives traffic from a multitude of sources. The Web Analytics dashboard is a convenient forum for showcasing performance metrics for your entire site, while outlining source-by-source contribution to KPIs such as:
- Sessions
- Average pages per session
- Average session duration
- Total events
- Total goal completions
- Goal conversion rate
You also have the ability to break out these metrics by traffic, conversion and engagement.
What Are the Best Marketing Dashboards for Your Team?
The best marketing dashboards are the ones that help you and your stakeholders, either internal or external, answer the vital questions about your marketing performance and, ultimately, your business.
As your marketing analytics practice evolves, you can acquire the ability to perform more complex analysis. That includes projects such as cross-channel marketing attribution or predictive analytics. A well-designed dashboard can be an invaluable resource for that kind of work.
If your team needs assistance either building a marketing dashboard or would like to use one of our marketing dashboard templates, Alight Analytics can help. Schedule a call today.
See Alight’s Marketing Dashboard Templates for Tableau in Action
Check out this webinar featuring Alight’s new Marketing Dashboard Templates for Tableau. You’ll see how each of the dashboards featured in this post work.