
Just getting started in marketing analytics — but not entirely sure where you should invest your time and money? For many teams, the first step involves reporting automation.
It’s an important early win — you no longer have to manually download your data and cut-and-paste it into a spreadsheet. Plus, reporting automation can make your team more efficient and lay the groundwork for more advanced analysis and reporting down the road.
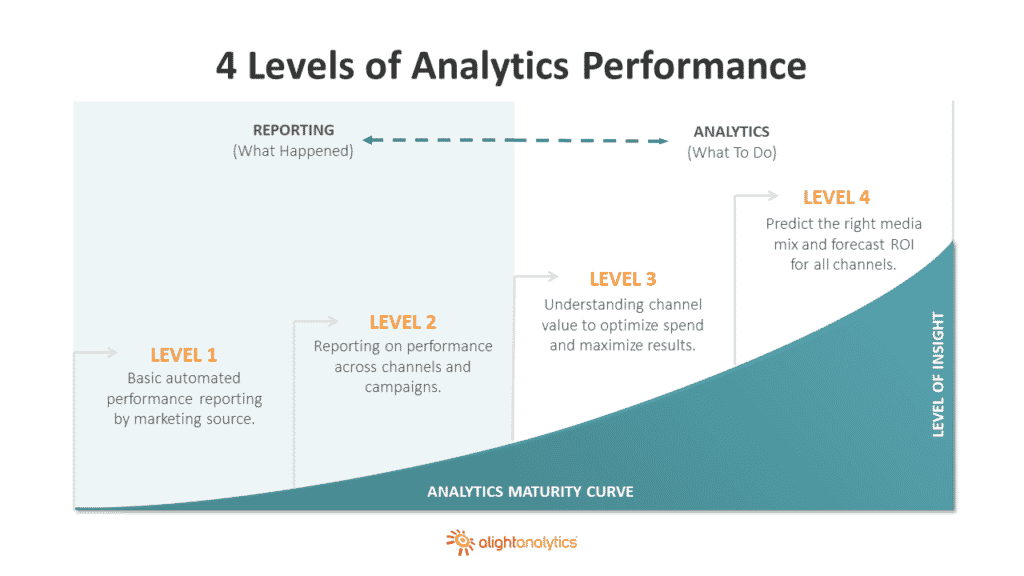
It’s the first of four stages in a brand or agency’s evolution toward richer insight, what we call the 4 Levels of Marketing Analytics Performance.
Today, we’re going to explain what Level 1 looks like, what you can do there, what resources it demands … and why you might eventually desire something more.
What Level 1 Looks Like
Level 1 is focused on “what happened when” reporting. You’re trying to answer questions like “How many people visited our website that week?” and “How many clicks did our Facebook ad get during April?” The goal is to build reports that track marketing performance, usually every month or quarter.
This is basic, but useful information. It shows whether your marketing is making any impact on awareness. For businesses that are advertising on just a few platforms, Level 1 reporting might be all the information they need.
What Kinds of Resources Do Marketing Teams Need at Level 1?
You’ll want to invest in both technology and people at Level 1.
Most marketers use one of two different reporting automation solutions here:
Connector tools: These are solutions that automatically pull data from Google Analytics, Google Ads and other source systems. Then they organize and store the data in a spreadsheet application like Excel.
If you want to visualize that data with a chart or graph, you’re basically limited to whatever tools are part of the spreadsheet app. They’re …. OK. Any kind of visualization is better than nothing, but your end-user won’t find them very engaging.
Examples: Supermetrics, Funnel
Basic dashboard tools: These platforms feed marketing data directly into a dashboard created by the tool. Those visualizations look professional, but because they’re based on a template, there are limits to how much they can be customized.
Also, basic dashboard tools don’t offer any storage — all the data lives in the source system. So you won’t have a way to clean up errors in the data or apply business rules before visualizing it.
Examples: DashThis, Klipfolio
Though software can streamline a big part of your reporting, you still need human beings to manage and utilize those reporting automation tools. Specifically, you’ll want to fill two roles at Level 1:
Analyst: The person who takes responsibility for building the reports and dashboards.
Strategist: Someone who presents the reports to clients, highlights significant findings and answers any questions.
On smaller teams, one person might fill both roles.
What Marketers Can’t Do at Level 1
At Level 1, it’s difficult to produce any business insights that go beyond the surface level. That’s because Level 1 tools don’t allow you to easily blend and join different kinds of datasets.
For example, it’s important to know how many people visited your landing page, but wouldn’t it be nice to understand what led them there? Was it your TV commercial, your email blast, your organic Twitter — or all of them working together?
You can’t answer that question because you can’t analyze your results by campaign or channel. All your data is siloed. You can look at your Facebook data, you can look at your Google Analytics data, but you can’t view them both in a single report. You can’t layer in sales, weather or geographic data, either.
Thinking Beyond Level 1 Automation

Level 1 is a good place to start, but you might have a bigger vision for your marketing analytics. If so, it’s wise to think about what you can do now to support more robust analysis later.
For starters, you can invest in a data solution that organizes, cleans and stores data in a flexible, reliable dataset for future use — like our ChannelMix platform. And you can start developing your team’s skill set so that, when the time comes for media mix modeling, cross-channel attribution and other advanced techniques, they’re ready, too.
Take the first step in your analytics journey. Invest in tools that allow you to streamline and simplify your marketing data aggregation. But keep thinking about where you want to go next.
Ready to build a better analytics practice? Download the No B.S. Buyers Guide for Marketing Analytics, a free report from Alight Analytics. The guide will:
- Give you an easy-to-implement strategy for finding the right solution for your unique marketing analytics needs.
- Highlight the most common types of solutions on the market — including their pros, cons and capabilities.
- Show you the most important questions to ask when considering a new platform, so you can get the greatest value for your money.