Tired of pie charts and looking for an alternative? You’re not alone.
It’s true, a nice round visualization can add some variety to the bar charts and line graphs in your marketing dashboard. And yes, pie charts are easy to build and use. Anybody who’s graduated from elementary school has worked with one.
Done right, pie charts show what each “slice of the pie” contributes to the larger whole and how one slice compares to others.
But pie charts have fallen out of favor with many dashboard developers because, well, a lot of other developers have misused them.
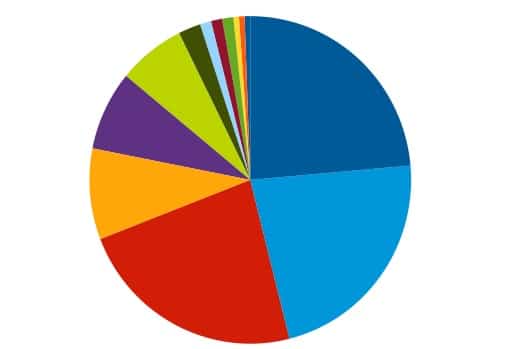
You’ve probably seen pie charts that have 10 or more slices, some of them as thin as a fingernail, making it harder to quickly tell which dimension or category is greater.
Or maybe you’ve encountered pie charts whose individual dimensions don’t add up to 100. Or are just difficult to understand because they use 3D or “exploded” views that distort what they’re trying to say.
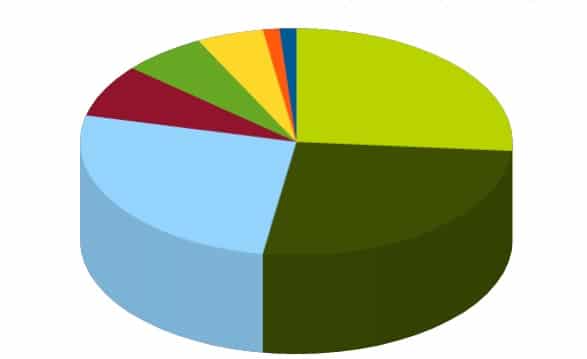
Look at the chart above. The three biggest pieces are all the same size, but it’d be easy to think the dark green slice is slightly larger than the light blue piece.

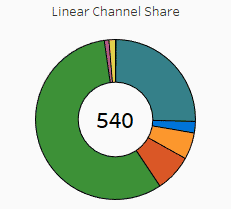
Don’t Like Pie? Try a Donut Chart
If you want to avoid pie charts, but still want to include a round visual in your report, try a donut chart.
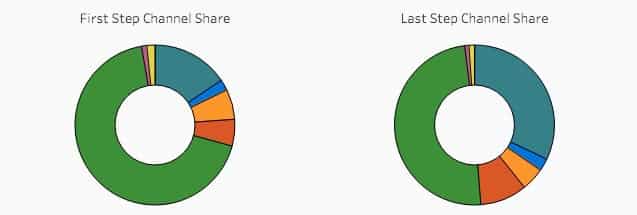
A donut chart is basically a pie chart with its center removed. Instead of slices, you use arc segments to display individual dimensions. This type of chart can help you compare individual categories or dimensions to the larger whole, just like a pie chart, but with a couple of advantages.
- Donut charts can make it easier for users to compare individual dimensions. Each of the donut arcs has the same width, but a different length. So when you compare which one is greater, you only have to make one point of comparison — which one is longer?
It’s a little trickier with pie charts, where individual dimensions are represented by an area (length and width). Some report developers argue that human brains are just a little better at visually comparing lengths instead of areas.
- The donut chart’s hole can be very handy if you want to include a little negative space in your dashboard or if you need a place to add another important number, like a sum-up value or a percentage comparing current results to the previous time frame.
Tips for Using Donut Charts and Pie Charts
Just to be clear: Donut charts aren’t magic. If you try to use too many dimensions, you’ll run into the same crowding problem that so many pie charts suffer from.
How many segments should you include in a donut chart? We usually recommend three to five, though some designers say you can use as few as two or as many as six.
(In some cases, you might be better off with a bar chart, another go-to visual for comparing and ranking categories or dimensions. As several developers have noted, a donut chart is basically a bar graph in circular form.)
And neither pie nor donut charts may be a good choice if there’s no real difference between the individual slices or segments.
As always, the ultimate deciding factor has to be your audience. What information do they need, and what’s the easiest way to communicate that information to them?
Alight Makes Marketing Dashboards Even Faster to Create
Of course, you don’t have to design your own dashboards. Alight’s end-to-end analytics solutions feature a full suite of ready-to-use dashboards for cross-channel reporting, multi-channel attribution, pipeline forecasting and so much more. Request a free 30-day solution evaluation using your data in our dashboards!