
If you’re a marketer who’s exploring data-driven attribution, you might encounter the concept of a Markov chain.
This is a really useful idea to understand. Basically, a Markov chain is used to model all the consumer paths in the dataset — what marketing messages and channels did someone in your audience encounter (and in what order) before they converted?
By modeling all the paths with a Markov chain, we can estimate the impact completely removing a channel would have on conversions. This basically tells us how valuable each channel is in driving conversions.

For example, if we stopped using display ads and conversions dropped by 20 percent, we have a working idea of the value we can attribute to display.
A Markov chain can help you explore channel value, so you can spend your marketing budget on your most effective tactics. This is one way we’ve been able to create a data-driven attribution model here at Alight.
In this post, you’ll learn the “method behind the madness” so you can better understand how this type of modeling works.
How a Markov Chain Works
A Markov chain needs pathing data that shows the order in which a customer encountered different marketing channels and whether the journey ended in a conversion.
This enables us to build models that can understand how sequences of interactions lead to conversions rather than the effect of a channel in isolation.
(If you use Google Analytics, its Multi-Channel Funnel (MCF) reports are a good example of this type of data. ChannelMix’s data-driven model also uses MCF-like datasets.)
One really important thing to note: Markov chains look at the probability of one interaction leading to another based only on the current interaction.
For example, a Markov chain might say a customer has a certain probability to interact with paid search immediately following paid social. But that judgment would be based only on the fact that the customer just encountered paid social and not on a slew of previous interactions.
This allows us to build a graph like the one shown in the image below summarizing all customer journeys. This graph shows all of the transitions from one channel to the next that are present in the pathing dataset and assigns a probability to each transition.
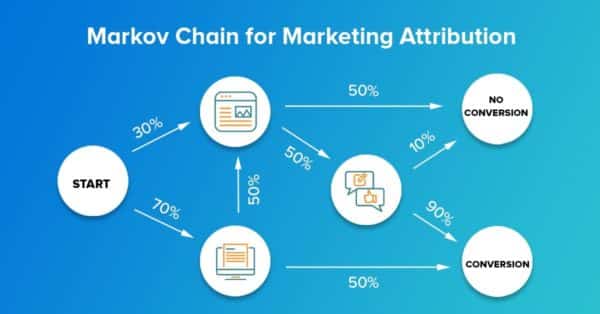
You can find these probabilities by counting how often a transition appears in our pathing dataset and dividing that by how often the initial channel appears in the dataset.
For example, we see that the Email to Display transition has 50% probability. This means that half of the time Email appeared in a customer journey, it was immediately followed by an interaction with Display.
(While there are no examples of this in the image, it is also perfectly acceptable for a channel to transition to itself, i.e. to get another Email instead of seeing a Display ad. Using the same logic I just described, we can find the probability of a channel to transition to itself.)
Once we calculate all of the transition probabilities, we can find the conversion probability for an entire path — for any path!
For example, we can see that the path (start) > Email > Conversion has a 35% probability by multiplying the probability of (start) > Email (70%) by the probability of Email > Conversion (50%): 0.7 * 0.5 = 0.35 or 35%.
This is great information, but doesn’t yet tell us the influence of any single channel over the entire dataset. To do that, we need to use the Removal Effect.
BLOG: How to Judge an Attribution Model’s Quality
What’s the Removal Effect?
The Removal Effect gives us a way to measure the contribution of any individual channel in producing conversions. This is done by completely removing the channel from the graph we’ve built and seeing the impact on conversions. The larger the impact, the higher the value attributed to the channel. We can do this iteratively for each channel to see the impact on conversions and ultimately quantify the value of each channel.
To calculate the Removal Effect, we start by calculating the probability of all converting paths. This is shown in the table below including the total probability of conversion accounting for all paths. Adding everything up, we see that the total conversion probability is about 64%.
| Path | Probability |
| Start > Email > Conversion (50% x 70%) | 0.35 |
| Start > Email > Display > Social > Conversion(70% x 50% x 50% x 90%) | 0.1575 |
| Start > Display > Social > Conversion (30% x 50% x 90%) | 0.135 |
| All Paths | 0.6425 |
Next, we calculate the conversion probability after removing each channel. As an example, let’s calculate the conversion probability for Email.
If we remove Email from the graph, the only converting path remaining is Start > Display > Social > Conversion with 13.5% conversion probability. This means the Removal Effect for Email is 1 – (.135 / .6425) = 0.79. Meaning we would lose 79% of our conversions if we completely removed email.
Remember, you’ll need to calculate the Removal Effect for the other channels, too. Once we have the Removal Effect for each channel, we can move on to the final step: attributing channel values.
Calculating Channel Value
The final step is to normalize the Removal Effects so they’re a little easier to interpret.
Normalizing just means that all values should add up to 1 so that we can interpret each value as a percentage. In this case, the normalized channel value directly represents the percentage of the total value attributed to that channel.
You can calculate this by adding up all the removal effect numbers (0.79 + 0.45 + 0.45 = 1.69) and then dividing each removal effect by the total. The normalized removal effect for Email would be 0.79 / 1.69 = 0.46.
The table below shows the results for our example. Now we see that Display and Social are equally valuable in driving conversions while Email is significantly more valuable.
| Path | Removal Effect | Normalized RE |
| 0.79 | 0.46 | |
| Display | 0.45 | 0.27 |
| Social | 0.45 | 0.27 |
| 1.69 | 1.0 |
One Final Word About Markov Chains
And there you have it: a high-level look at Markov chains and how they work for channel attribution!
One word of warning: While this example was easy enough to calculate with a pen and paper, typical campaigns have more channels and many more connections, including self-connections where a customer keeps engaging with the same channel over and over again, leading to more complex calculations. To produce this kind of analysis at scale, you’ll need dedicated resources like a data scientist.
Multi-Channel Attribution Made Simple
Alight’s end-to-end analytics solutions feature multi-channel attribution models, built right into Power BI or Tableau, to help you reduce the time and cost to generate a conversion. Schedule a free solution consultation with our team!