
Want to improve your lead quality? Wish your lead conversion rate was a little stronger? To get the insight you need to optimize your sales and marketing strategy, focus on “between the box” metrics.
Here’s what I mean. Look at your marketing and sales pipeline as a set of six boxes, each one representing a key stage.
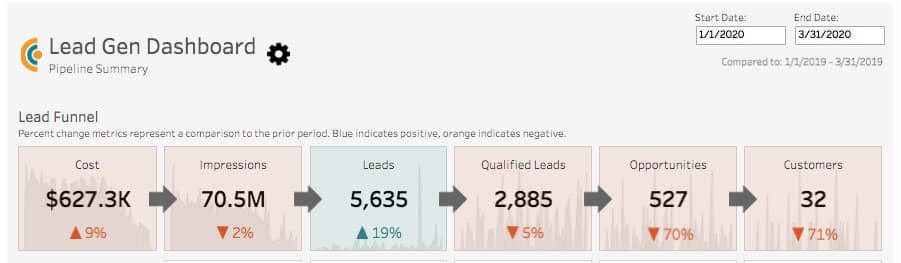
- Cost: How much are you spending on marketing, advertising and promotions?
- Impressions: How much awareness are you creating or buying? How many people saw your ads, opened your emails, visited your website, etc?
- Leads: How many contacts did you collect as a result of your campaigns?
- Qualified Leads: How many of these contacts are people who have the budget, authority and need for your product, and have a timeline for making a purchase?
- Opportunities: Of your qualified leads, how many are a good fit for your specific products or services?
- Customers: How many contacts became your paying customers?
Those six stages give you a quick look at the overall state of your sales and marketing efforts. (Your pipeline might look a little different depending on your organization’s process or goals. Not everybody includes cost and awareness in their pipeline, but it’s important to know if what you’re putting in at the beginning has any impact downstream.)
Lead Conversion Lives Between the Boxes
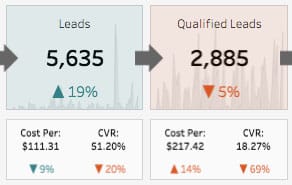
For optimizing lead quality, your most important KPIs are the ones that live between each of those boxes. There are two basic types:
Cost per is how much it cost to produce a single impression, lead, qualified lead, opportunity or customer.
Conversion rate (CVR) shows you the “graduation rate” between stages. What percentage of qualified leads turn into opportunities? How many opportunities become customers?
These are not hard to calculate, but they’re powerful because they illustrate the relationship between each pipeline stage.
For starters, you can identify places where processes are breaking down. Maybe the conversion rate from opportunities to customers is noticeably low. That could mean there are problems with how your team is closing deals. Or maybe you need to look at how leads are being vetted earlier in the funnel.
Between-the-box metrics are useful for planning and forecasting, too. If you know that it takes 100 leads to produce one new customer, and it costs $200 to produce a lead, you can then calculate how much you need to spend to generate 20 new customers.
BLOG: Avoid the biggest mistakes when measuring lead conversions.
There are three between-the-box metrics that marketers should pay particular attention to:
- How much does it cost to generate a lead? AKA cost per lead. This shows if you have the budget necessary to hit your lead goals and can help you avoid overspending on media.
- How many impressions are required to generate a lead? Are your inbound and digital campaigns generating enough awareness to hit your lead target?
- What’s the conversion rate between leads and qualified leads? That is, how many of your marketing-created contacts have not only demonstrated interest in your products, but also have the necessary budget, authority, need and timeline that make them a potential fit for your company?
Changing the Conversation Around Lead Quality
That last KPI is a good way to gauge the quality of Marketing’s leads. You might feel that you’re doing a great job because you’ve generated 1,000 leads, but Sales thinks they’re all trash. Conversations like this happen all the time. Maybe you’ve been in a few meetings like that!
Creating a holistic pipeline view — one that measures each funnel stage and the “between the box” KPIs connecting them — changes the conversation and moves it beyond Sales vs. Marketing finger-pointing.
You’re not talking about how pretty my creative is or how many view-through conversions I got. You’re having a data-driven, results-focused discussion where Marketing and Sales are both at the table and being held accountable.
By going from box to box, you can see how each funnel stage works together to generate business growth. If part of your funnel is out of alignment, you’ll know exactly where to focus your attention and improve your lead quality and lead conversion rate.
That’s what we want. And that’s how you should use analytics.
Get the Insight You Need to Maximize ROI and Drive Growth
Alight’s Lead Generation Analytics solution combines an award-winning platform with analytics experts, enabling you to generate powerful insights and reporting for your entire funnel. Schedule a free solution consultation with our team!